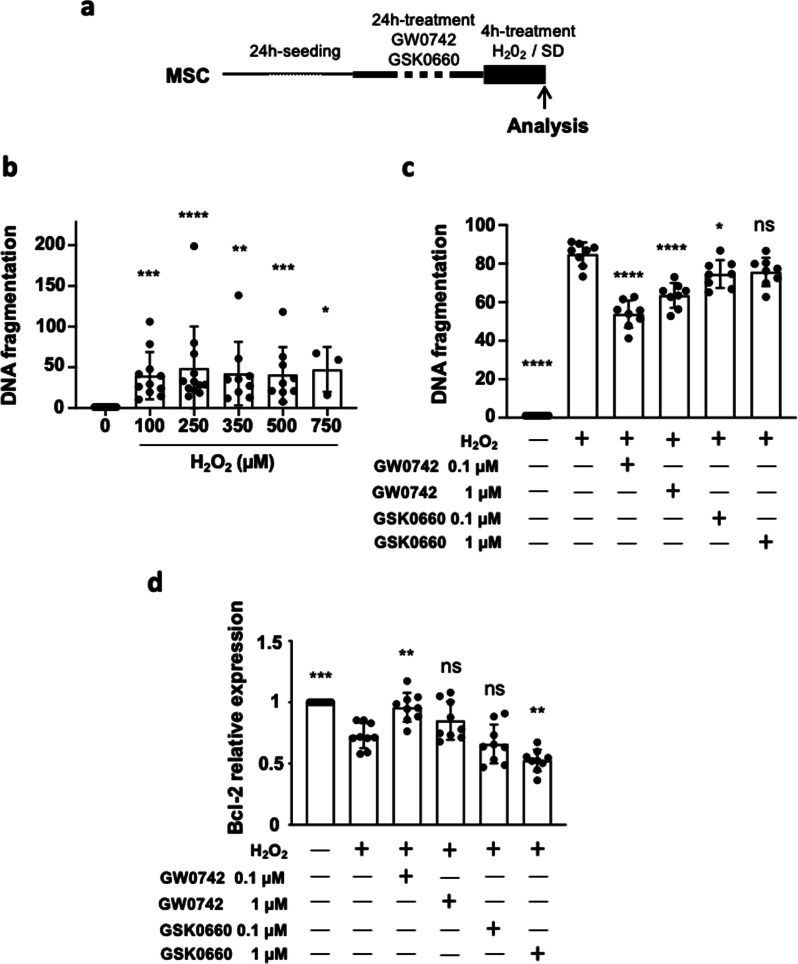
Fig. 1.
Decreased apoptosis in PPARβ/δ-primed MSC exposed to H2O2 stress. a 48 h after the seeding step in complete medium, MSC were subjected to H2O2-induced oxidative stress during 4 h in minimal medium with serum deprivation. Pharmacological preconditioning of MSC using PPARβ/δ agonist or antagonist was performed 24 h before oxidative stress exposure. At the end of the protocol, cell death or relative gene expression was analyzed measuring specific DNA fragmentation by ELISA and transcript amounts by RT-qPCR. b Scatter plot and bars were presented for specific DNA fragmentation quantification measured in MSC treated with H2O2 at various concentrations (0, 100, 150, 250, 500 and 750 µM) for 4 h in minimal medium. Data (normalized to the value obtained for MSC without H2O2) were plotted as scatter dot blots and mean ± SD for each group of treatment and compared using Kruskal–Wallis (Dunn’s post hoc test) and were noted vs the 0 µM H2O2 group (n = 15, independent cultures) ** for p = 0.0003 (100 group, n = 10), **** for p < 0.0001 (250 group, n = 12), ** for p = 0.0011 (350 group, n = 9), *** for p = 0.0010 (500 group, n = 9) and * for p = 0.0296 (750 group, n = 3). c Scatter plot and bars were presented for specific DNA fragmentation quantification measured in MSC pre-treated with GW0742 or GSK0660 at 0.1 and 1 µM 24 h before H2O2 exposure (250 µM, 4 h). Data (normalized to the value obtained for MSC without H2O2) were plotted as scatter dot blots and mean ± SD for each group of treatment and compared using ANOVA followed by the Tukey’s post hoc test (normality test passed). P values vs MSC/ H2O2 were noted **** for p < 0.0001 (MSC without H2O2), vs 0.1 µM GW0742 and vs 1 µM GW0742), * for p = 0.0402 (MSC/H2O2 vs 0.1 µM GSK0660) and ns for p = 0.0582 (MSC/H2O2 vs 1 µM GSK0660). In each case, n = 8 independent cultures were evaluated. d At the end of the protocol, mRNA expression levels in untreated or preconditioned MSC exposed to an H2O2 were assessed by RT-qPCR for Bcl-2: data (mean ± SD; n = 8 for each group) normalized to the control values were compared using ANOVA and the Tukey’s post hoc test (normality test passed). P values vs MSC/H2O2 were noted for *** for p = 0.0001 (MSC without H202), ** for p = 0.0015 (GW0742 0.1 µM), ns for p = 0.2379 (GW0742 1 µM), ns for p = 0.8168 (GSK0660 0.1 µM) and ** for p = 0.0076 (GSK0660 1 µM)

