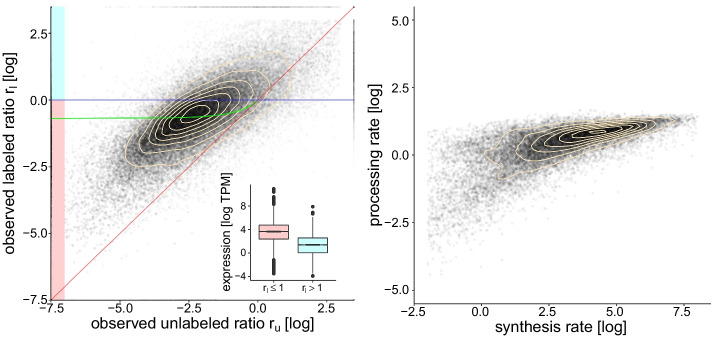
Fig. 3.
Real data. Left: Each point corresponds to a transcript with its transparency reflecting log expression value. Like in the previous figure, the green line is defined . For transcripts lying between the abscissa (in blue) and the green line, estimates of processing and degradation rates can be obtained by solving (13). For transcripts lying between the diagonal (in red) and the green line, estimates can be obtained by minimizing (16). The observed ratios for the remaining transcripts are not coherent with the model and are discarded. These trancripts (above the blue line) are lowly expressed compared to the ones below the blue line (see inset). Right: RNA processing rates are highly correlated to the synthesis rates (73%), which is consistent with co-transcriptional RNA processing. In both plots, density contour lines are shown in beige and axes are cropped for a better view of the data

