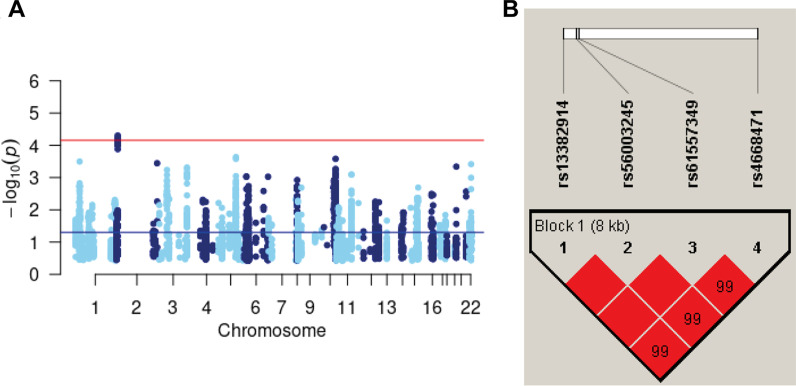
Fig. 2.
Haplotype blocks for the asthma-associated locus. This figure shows the Manhattan plot a for the meta-analysis including the Saguenay–Lac-Saint-Jean asthma familial cohort (SLSJ cohort) and the Canadian Cohort Obstructive Lung Disease (CanCOLD) for the 2p24.3 COPD locus, and b haplotype blocks formed by the 4 SNPs associated with asthma in the 2p24.3 COPD locus using genotypes from the SLSJ cohort (done with Haploview software). The color of squares illustrates the strength of pairwise linkage disequilibrium (LD) values on a red and white scale where red indicates perfect LD (r2 = 1.00) and white perfect equilibrium (r2 = 0)

