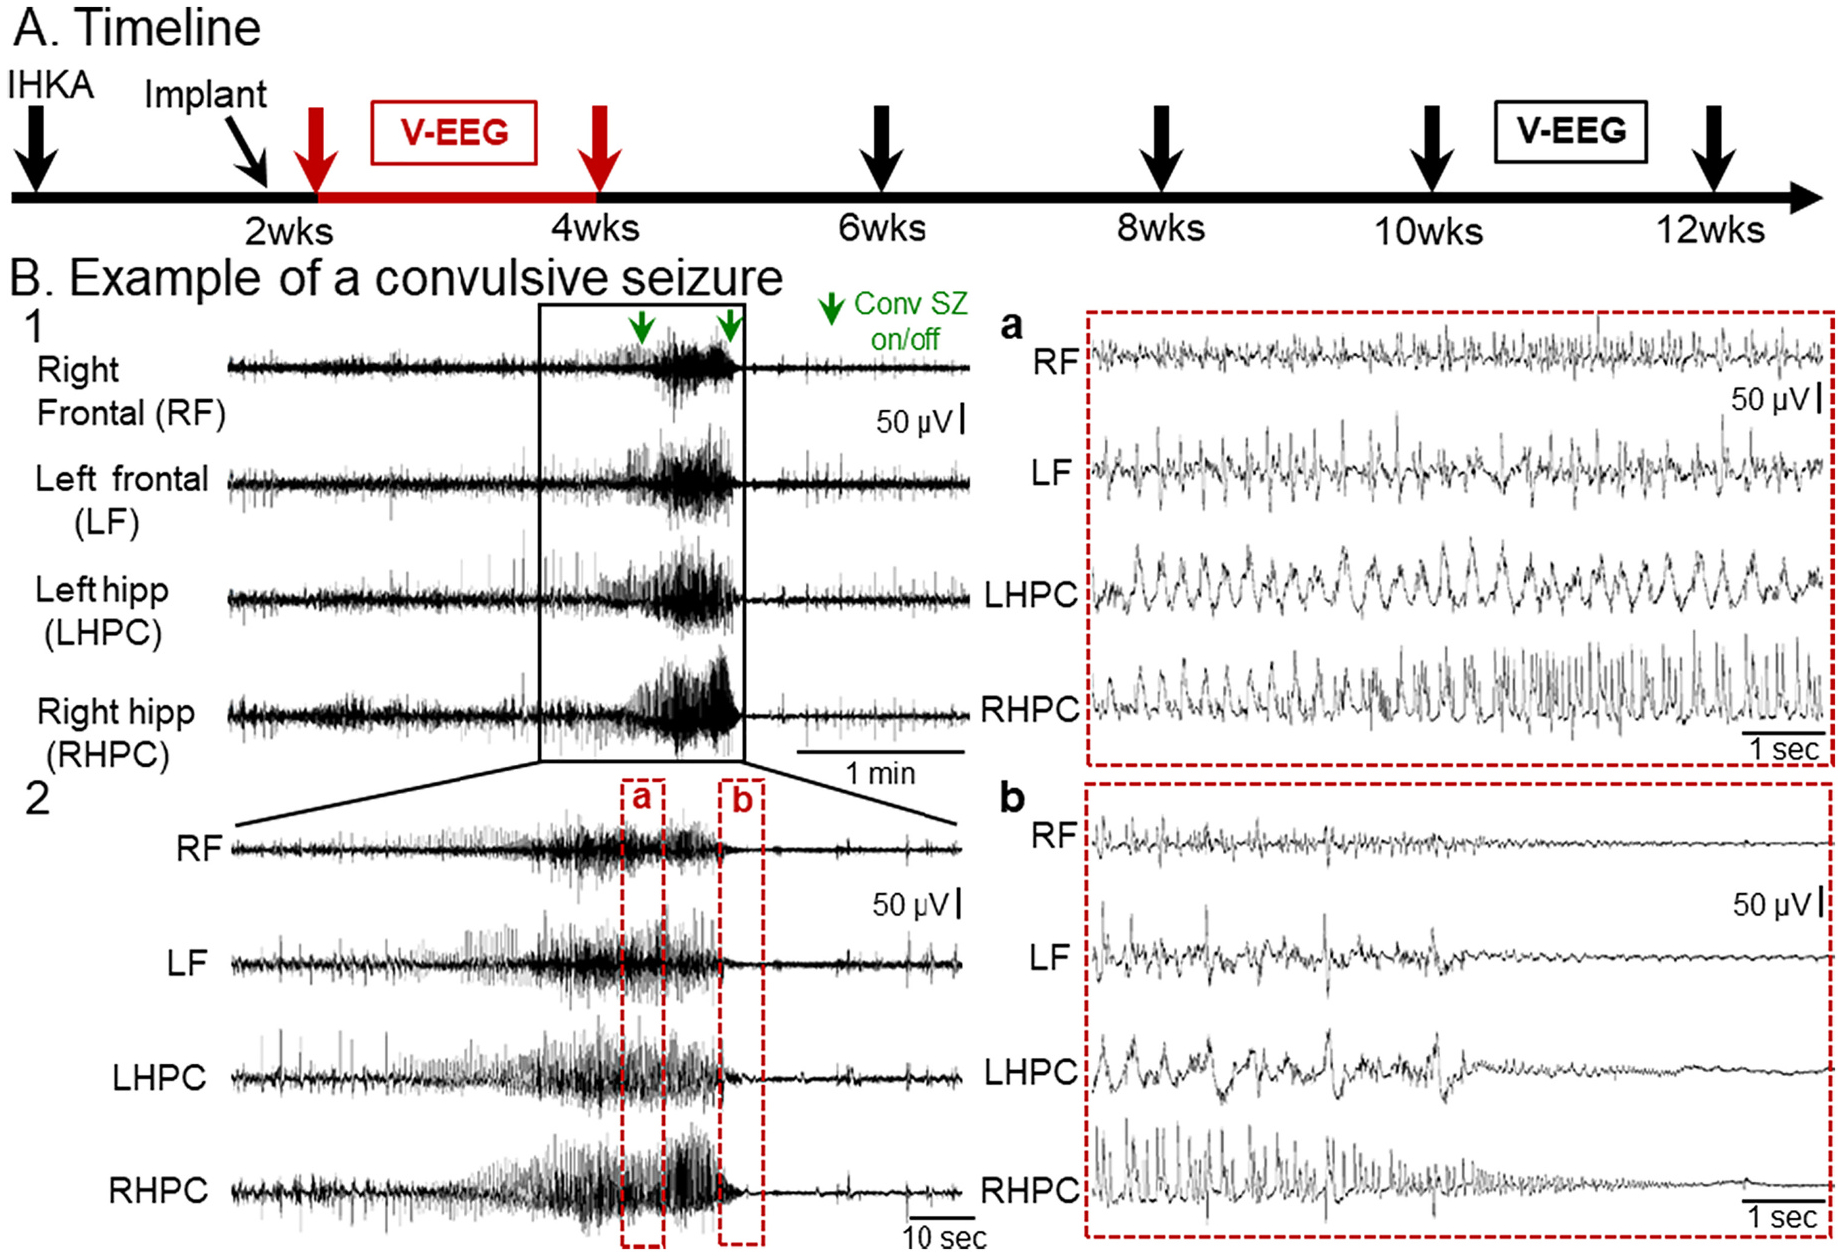
Fig. 1.

Example of a spontaneous convulsive seizure recorded 2–4 wks after IHKA
(A) Experimental timeline of the study. Animals were injected with KA in the left dorsal hippocampus and 10 days later they were implanted with 4 subdural screw electrodes. They were then vEEG monitored 2–4 wks post-IHKA continuously (red arrows, with data from this time shown in B) and then recorded again at 10–12 wks post-IHKA.
(B) Representative example of a chronic convulsive seizure recorded during the 2–4 wk session after IHKA. Four leads were used to record right and left frontal cortices and left and right hippocampal regions. A 5 min-long EEG trace with seizure activity in all 4 leads is shown in B1. The start and the end of the convulsive seizure is indicated by green arrows (Conv SZ on/off). The same seizure is shown in a 2 min-long time window in B2 and further expanded (a, b) in 10 s epochs to better show the EEG complexity. Inset a of the seizure in B2 shows complex and often rhythmic activity with fast and slow components. Inset b of the seizure in B2 shows prolonged suppression of the background EEG in all 4 leads after the termination of the electrographic manifestations of the seizure.
