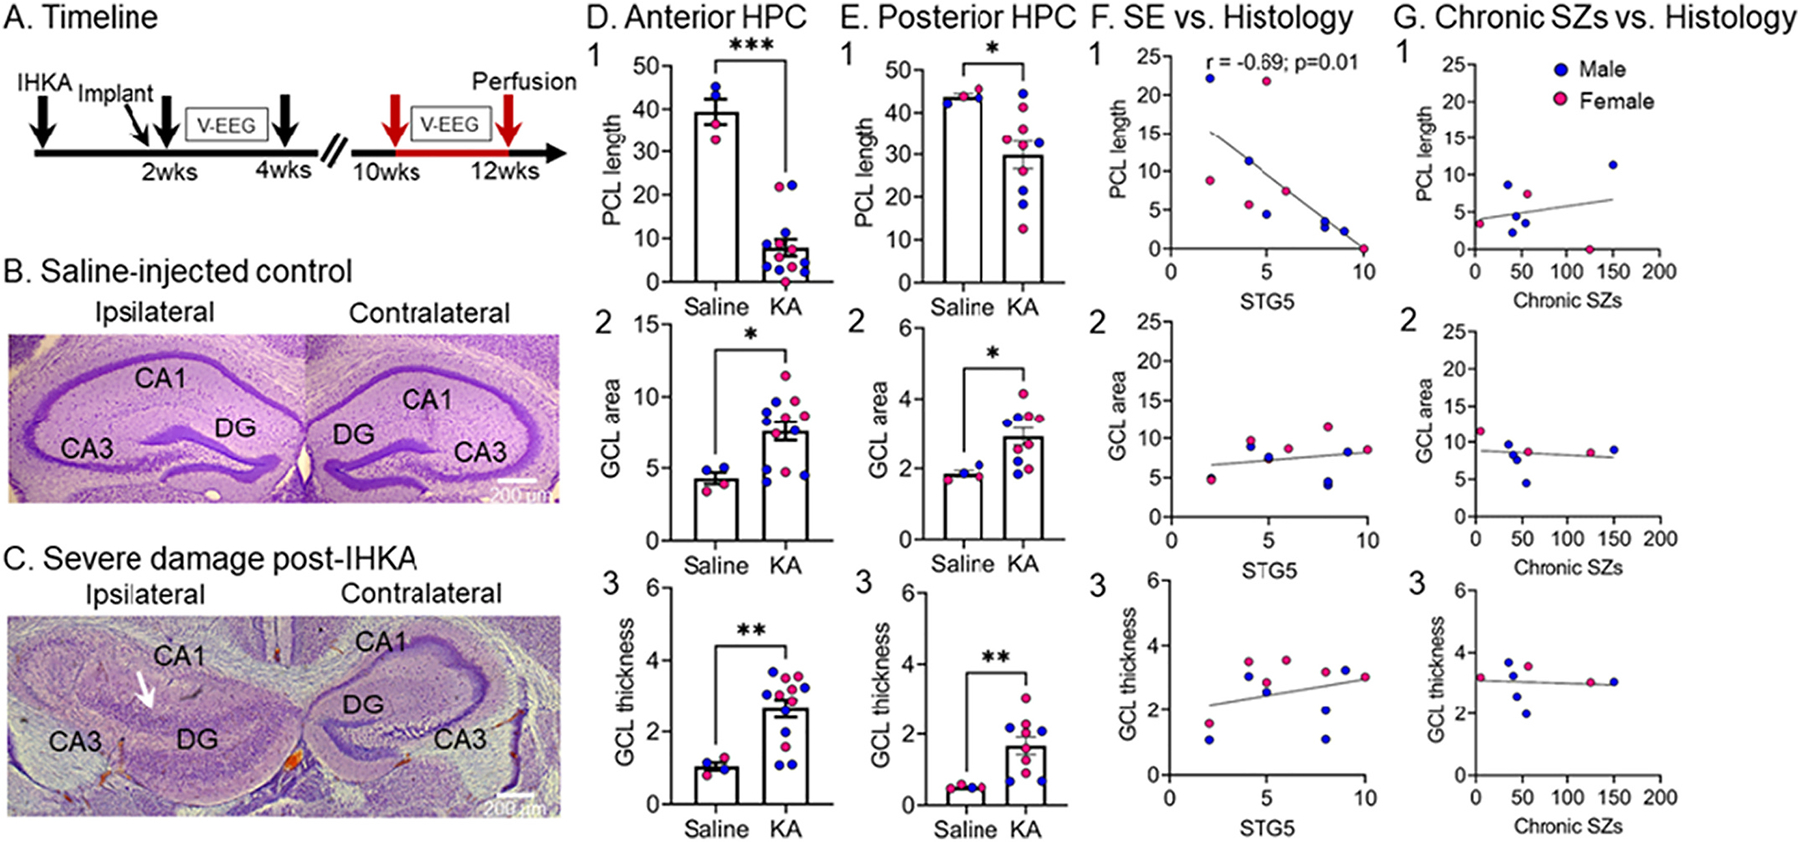
Fig. 11.

Quantification of hippocampal damage at 12 wks post-IHKA
(A) Experimental timeline of the study indicating the time animals were perfused at 12 wks post-IHKA (red arrows). Neuronal damage was quantified based on cresyl violet-stained coronal sections that were adjacent (−2 mm A-P, ±1.25 mm M-L, 1.6 mm D–V) and more posterior (−2.5 mm A-P, ±1.25 mm M-L, 1.6 mm D–V) to the IHKA injection site corresponding approximately to plate 47 and 51 of a standard mouse stereotaxic atlas (Franklin and Paxinos, 1997).
(B) An example of a Saline-injected control showing that there is no obvious hippocampal damage. Calibration bar: 200 μm.
(C) An example of severe hippocampal damage adjacent to the IHKA injection site. Note extensive neuronal loss in all pyramidal layers of the left hippocampus. Also, note extensive granule cell dispersion (white arrow). Calibration bar: 200 μm.
(D) Measurements of the IHKA-injected hippocampus adjacent to the IHKA injection site are shown. Neuronal damage in the pyramidal cell layers was quantified by the length of the pyramidal cell layer (PCL) which did not exhibit neuronal loss. Note the reduced PCL length in IHKA vs. Saline-injected animals (Mann-Whitney U test, U = 0, p = 0.0008; D1). Granule cell layer (GCL) area was used as a reflection of granule cell dispersion with larger GCL area in IHKA vs. Saline-injected animals (Mann-Whitney U test, U = 7, p = 0.031; D2) The width of the GCL was used as another measure of granule cell dispersion, confirming that the GCL is wider in IHKA vs. Saline-injected animals (Mann-Whitney U test, U = 4, p = 0.01; D3).
(E) Same as in D, but measurements were taken for sections that were more posterior to the IHKA injection site. Note significant reduction in PCL length (Mann-Whitney U test, U = 3, p = 0.01; E1), increased GCL area (Mann-Whitney U test, U = 3, p = 0.01; E2) and thickness (Mann-Whitney U test, U = 0, p = 0.002; E3) compared to Saline-injected controls.
(F) There was a significant correlation between the number of stage 5 seizures during IHKA-induced SE and PCL length (r = −0.69, p = 0.01; F1), but not GCL area (r = 0.22, p = 0.48; F2) and not GCL thickness (r = 0.29, p = 0.35; F3). All IHKA-injected animals were included in the analyses.
(G) There was no significant correlation between the total number of chronic seizures (at both timepoints; 2–4 and 10–12 wks) and PCL length (r = 0.23, p = 0.57; G1), GCL area (r = −0.15, p = 0.71; G2) or GCL thickness (r = −0.08, p = 0.84; G3) at 12 wks post-IHKA. For the total number of chronic seizures, seizures were pooled for the two timepoints and only those animals with recordings at both timepoints are included.
