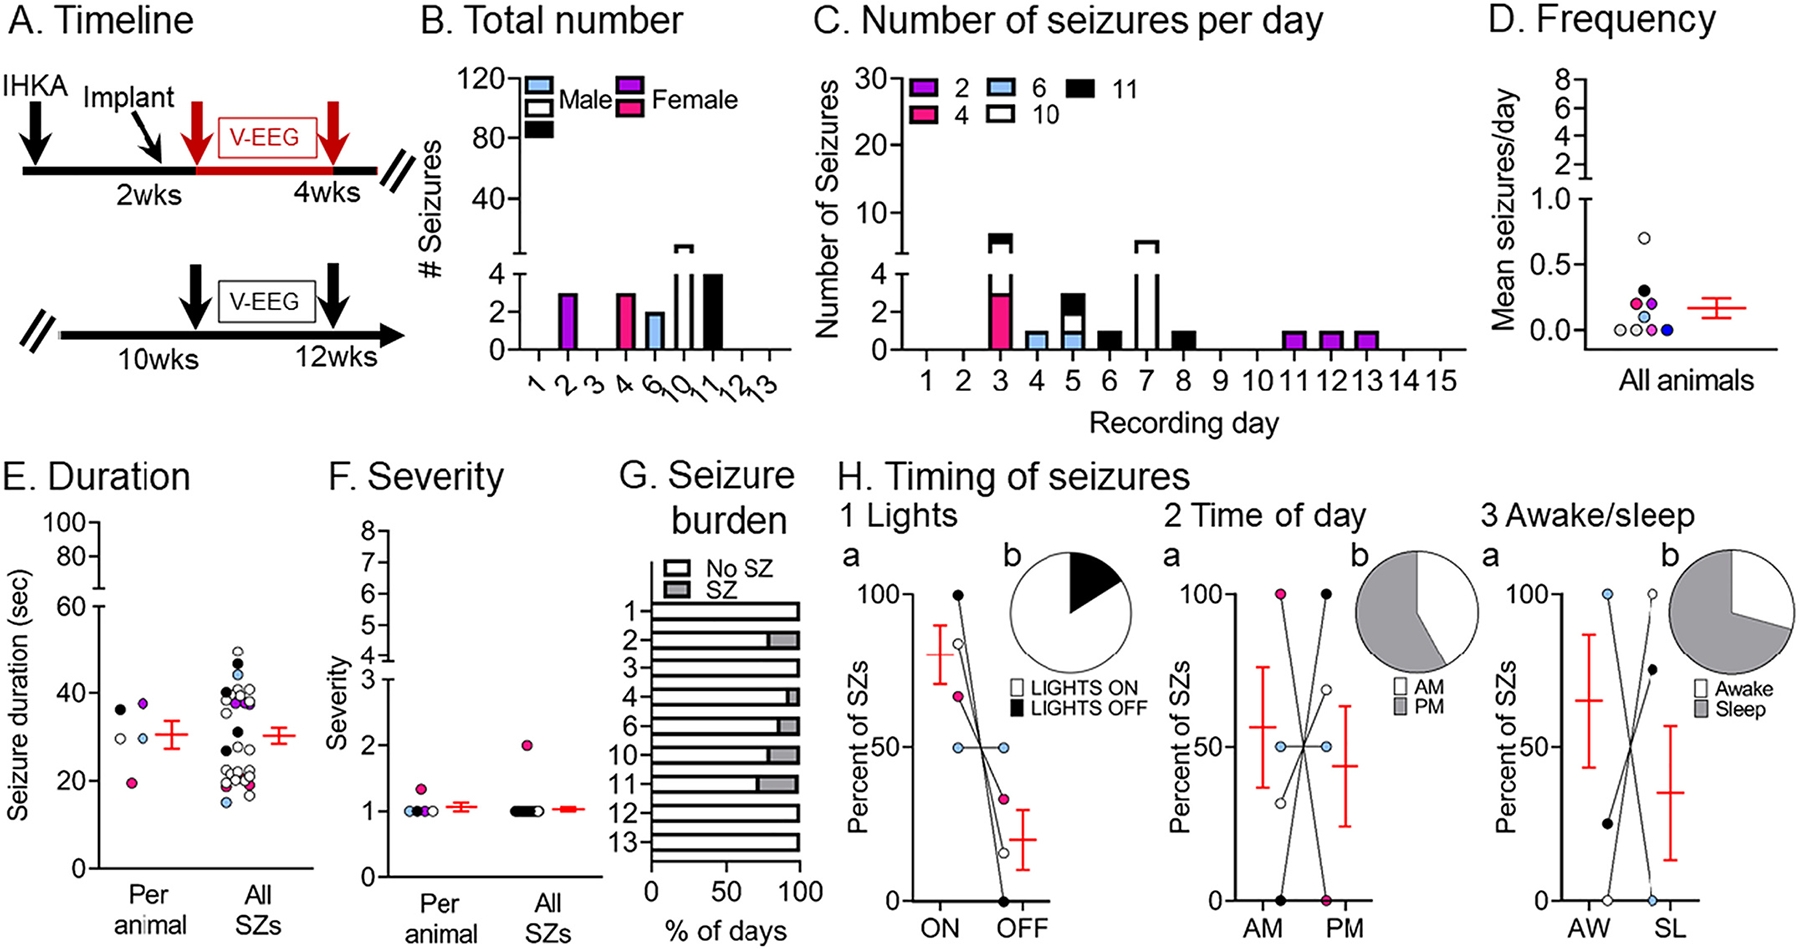
Fig. 5.

Quantification of chronic spontaneous non-convulsive seizures 2–4 wks post-IHKA
(A) Experimental timeline of the study. The seizures for this figure were recorded 2–4 wks after IHKA (red arrows; total # seizures = 31). The mice were the same as those used for convulsive seizure measurements.
(B) The total number of chronic non-convulsive seizures during the 2 wk-long recording period is shown per animal. Blue/white/black and pink shades represent males and females, respectively.
(C) The number of non-convulsive seizures per day and per animal is shown for all recording days.
(D) Non-convulsive seizure frequency was calculated as the mean number of non-convulsive seizures per day for each animal. In D–F and H, data are presented as individual values and as mean ± SEM (red).
(E) Non-convulsive seizure duration was calculated as the mean per animal (left) or the mean of all non-convulsive seizures (right; n = 31 seizures).
(F) Non-convulsive seizure severity was calculated as the mean per animal (left) or the mean of all non-convulsive seizures (right; n = 31 seizures).
(G) Non-convulsive seizure burden was defined as the percent of days spent with (SZ) or without (No SZ) non-convulsive seizures in the 2–4 wk-long recording period.
(H) The percent of non-convulsive seizures is shown, either occurring during the light period or dark period of the light:dark cycle (Lights ON or OFF; H1), a.m. or p. m. (AM/PM; H2), and awake (AW) or sleep (SL) state. Percentages are shown for the mean per animal (H1a, H2a, H3a) or the mean of all seizures (H1b, H2b, H3b). Note that in H2a there are 5 animals but the lines for 2 of the animals overlap since all of their seizures occurred during AM. In H3a, all seizures in 3 animals occurred during the awake state (lines are overlapping). Statistical comparisons: H1a, not significant (Wilcoxon signed rank test; p > 0.05); H2a, not significant (Wilcoxon signed rank test; p > 0.05); H3a, not significant (Wilcoxon signed rank test; p > 0.05).
