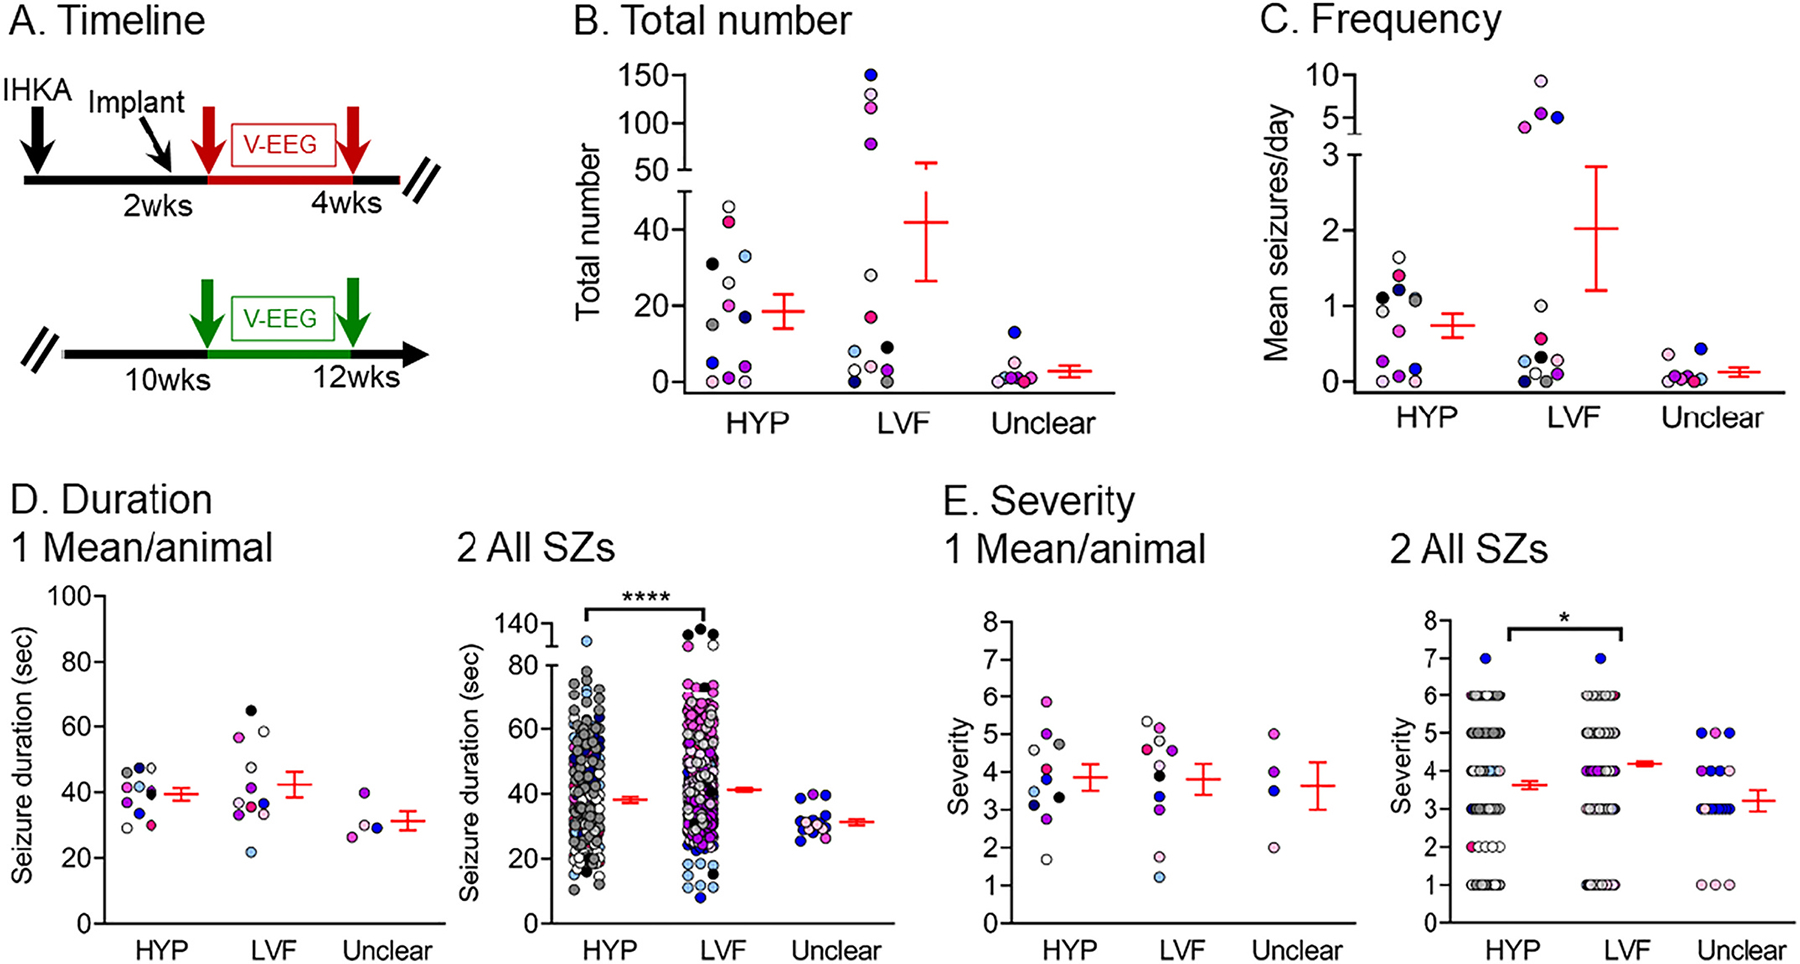
Fig. 8.

Quantification of low-voltage fast and hypersynchronous onset seizures
(A) Experimental timeline of the study. The data used for this figure were pooled from the 2–4 wk (red arrows) and 10–12 wk timepoints (green arrows), and a total of 800 seizures were included in the analyses. Seizures were distinguished as HYP, LVF, or seizure onset type was unclear. There were 13 mice (7 males, blue/white/black/gray, recorded at both 2–4 and 10–12 wks; 6 females, pink shades, where 2 were recorded at both times, and 4 were recorded only at one of the times).
(B) The total number of seizures is shown. There was no significant difference between HYP and LVF seizures (Wilcoxon signed rank test, p = 0.72). In B-E, data are presented as individual values and as mean ± SEM (red).
(C) Same as B but the frequency of seizures is plotted. There was no significant difference between HYP and LVF seizures (Wilcoxon signed rank test, p = 0.77).
(D) Same as B but seizure duration is shown. Seizure duration was calculated as an average per animal (D1), or all seizures were pooled (D2). LVF seizures lasted significantly longer than HYP seizures when all seizures were pooled (D2; Wilcoxon signed rank test, p < 0.0001) and not when duration was calculated as an average per animal (D1; paired t-test, p > 0.05).
(E) Same as B but seizure severity is shown. Seizure severity was calculated as an average per animal (E1) and for all seizures (E2). LVF seizures were significantly more severe than HYP seizures when all seizures were pooled (E2; Wilcoxon signed rank test, p = 0.02). In other words, E1 was not significant but E2 was, and that result is likely to be due to the large number of seizures in E2 compared to animals in E1.
