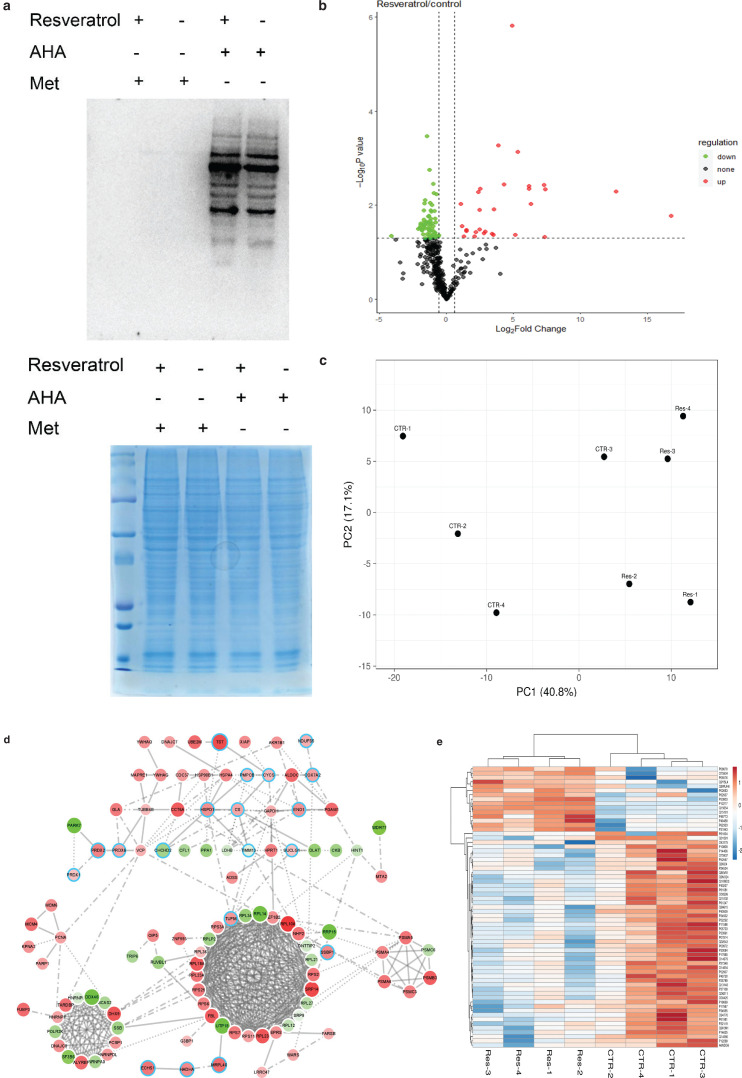
Fig. 2.
Effects of resveratrol on the nascent proteome. (a) Western blotting for streptavidin horseradish peroxidase (HRP). (b) Volcano plot showing newly synthesized protein with significant changes in mass spectrometry results. The abscissa is the logarithm of the fold change in differential protein expression in the comparison group. Each point represents a specific protein. Significantly upregulated proteins are labeled with red, and significantly downregulated proteins are labeled with green. Proteins that were not significantly differentially expressed are labeled with black. (c) PCA-SVD with imputation was used to calculate principal components. CTR: control. Res: resveratrol. (d) Dramatic changes in nascent proteins were visualized by STRING database. The cutoff was set as 1.5-fold change and P < 0.05. The nascent protein level reduced by resveratrol is shown in red, and the nascent protein level increased by resveratrol is shown in green. The size of the circle indicates the fold change, and the large circle indicates a higher fold change. Mitochondrial or redox proteins are highlighted in blue. (e) Heatmap of nascent proteins quantified from cells with different treatments.

