Figure 1.

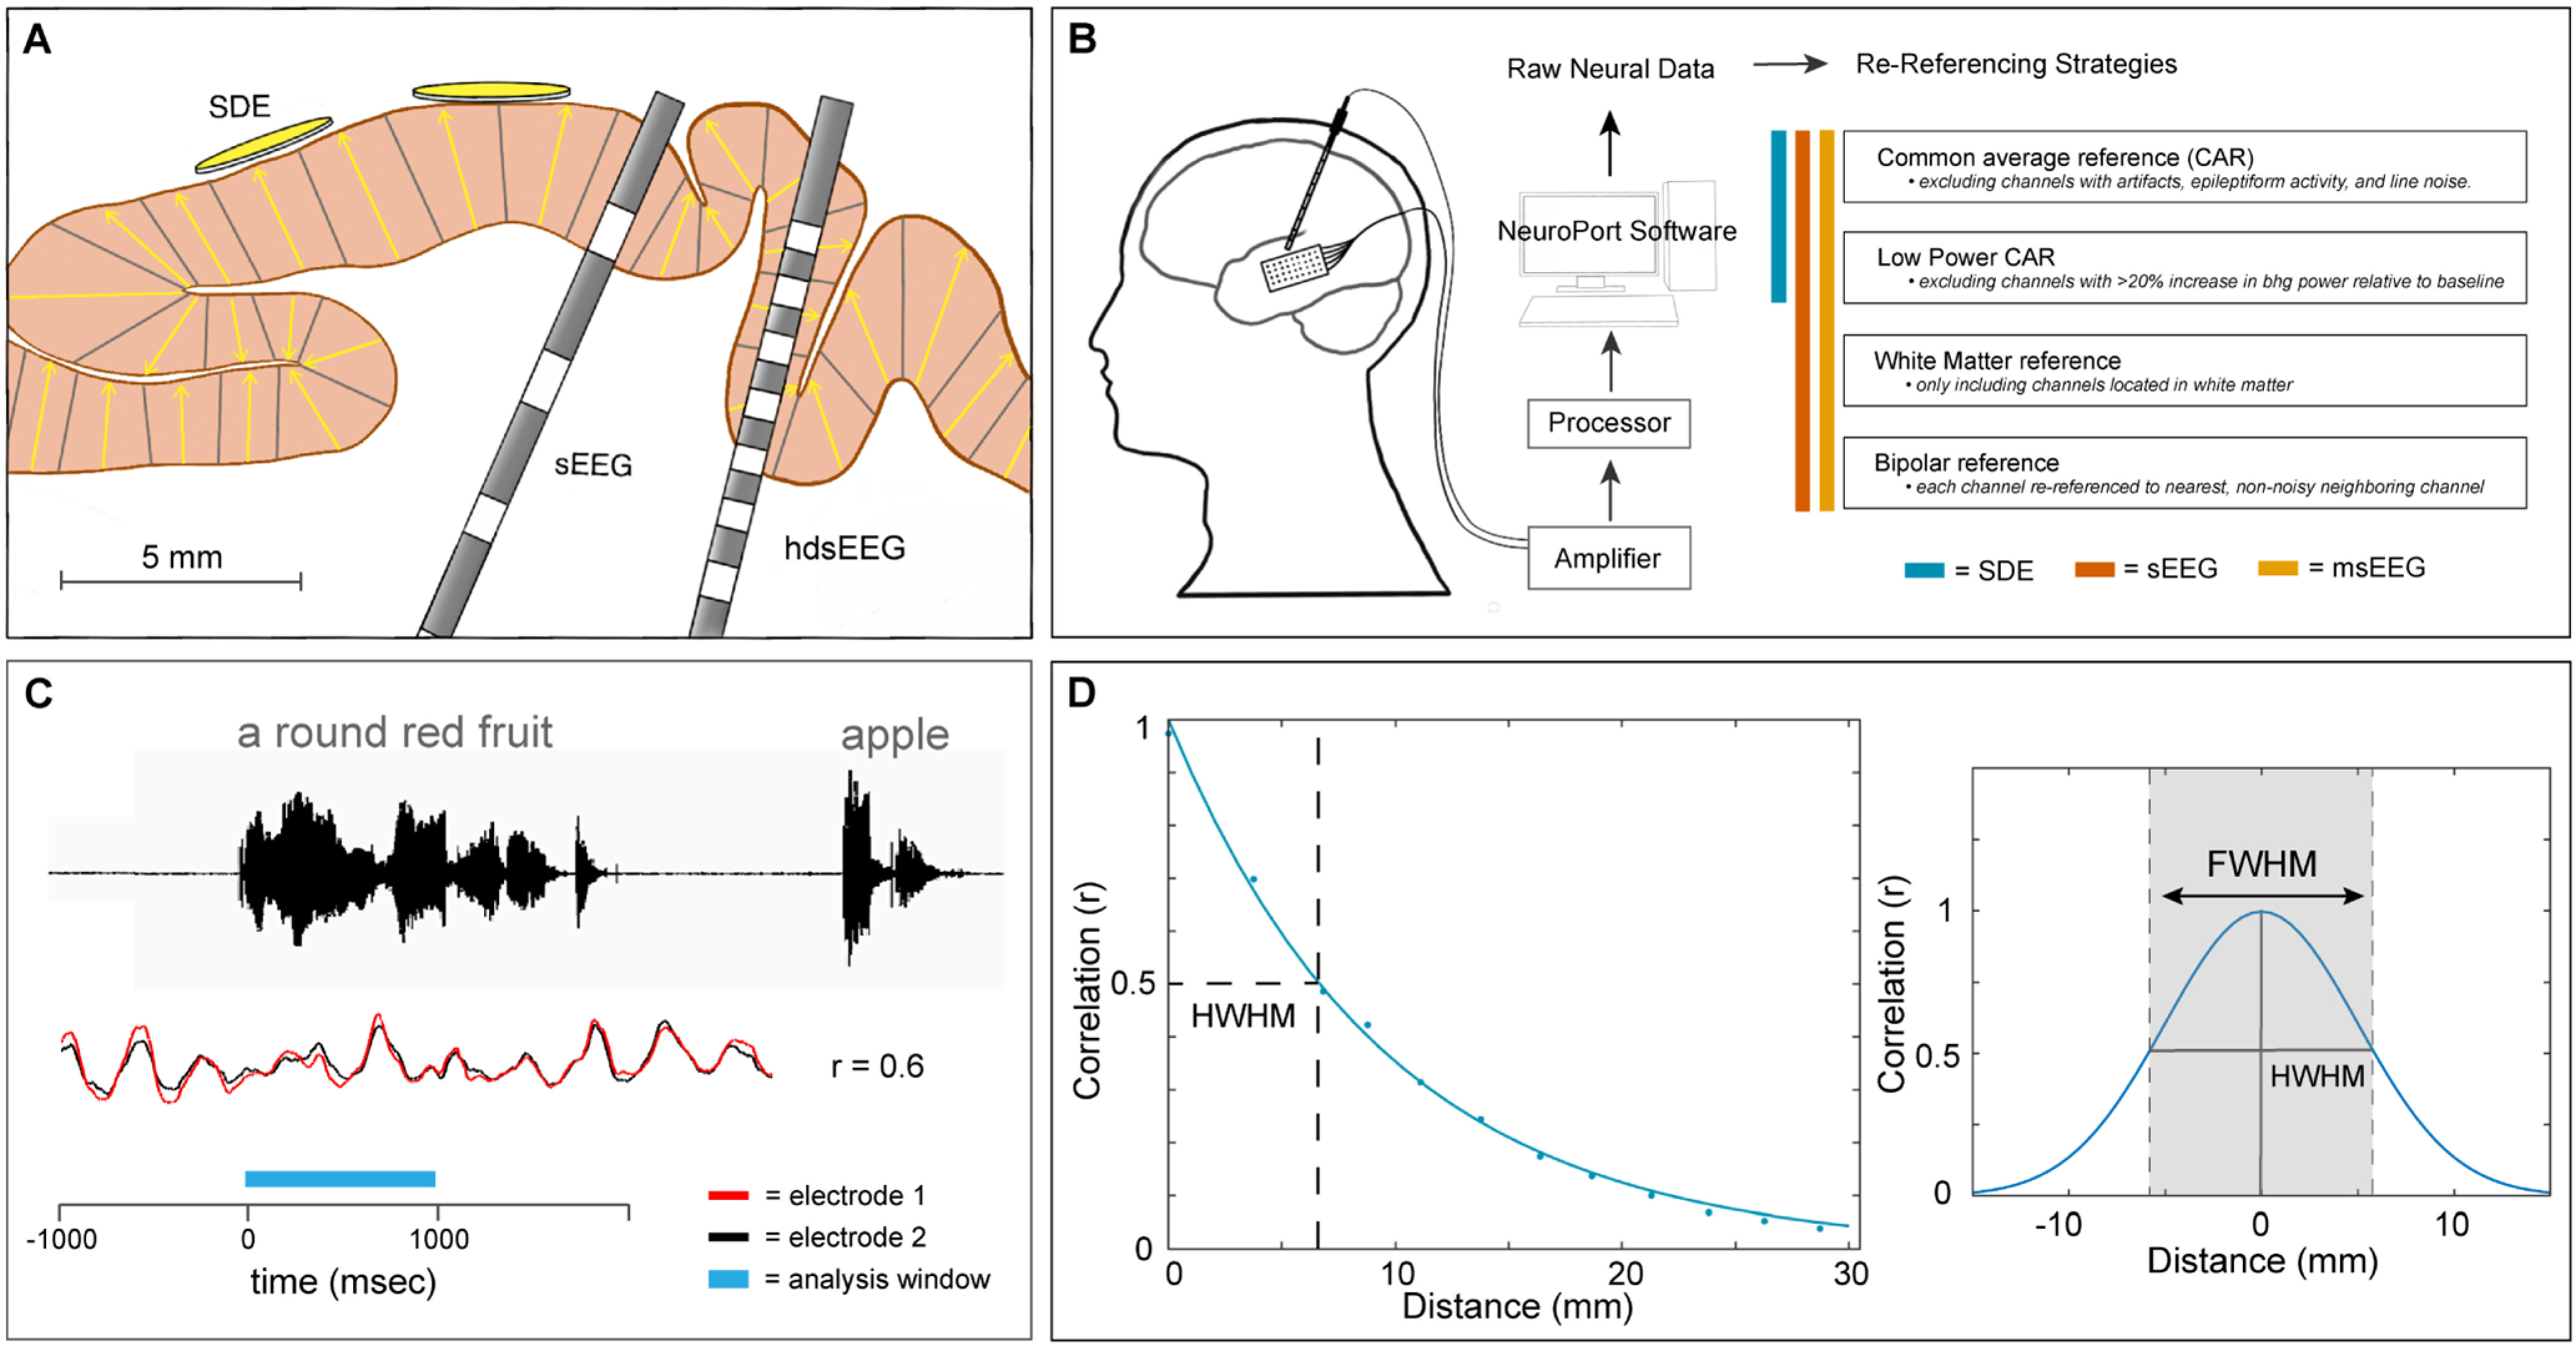
Experimental design. A, Schematic representation of the three electrode scales analyzed: SDEs 3 mm diameter disk, sEEG electrodes 2 mm-long ring, and hdsEEG electrodes 0.5 mm-long ring. sEEG and hdsEEG contacts are depicted in gray. Yellow arrows depict dipole orientation within pictured cortical gray matter. B, Schematic representation of the neural data acquisition and re-referencing strategies. C, Schematic representation of the auditory naming to definition task. Colored bar indicates task-related analysis window (blue; 0–1000 ms), during which cross-correlation (r) is calculated between the waveforms of two exemplar neighboring electrodes (red and black; exemplar traces). D, Example of full width at half maximum (FWHM) calculation. The correlation coefficient was measured using the raw voltage of every combination of electrode pairs within 30 mm of each other, for each frequency range. Correlation values were fit with an exponential decay function. Half width at half maximum (HWHM) correlation was measured from this exponential decay function and doubled to generate the FWHM value for each condition.
