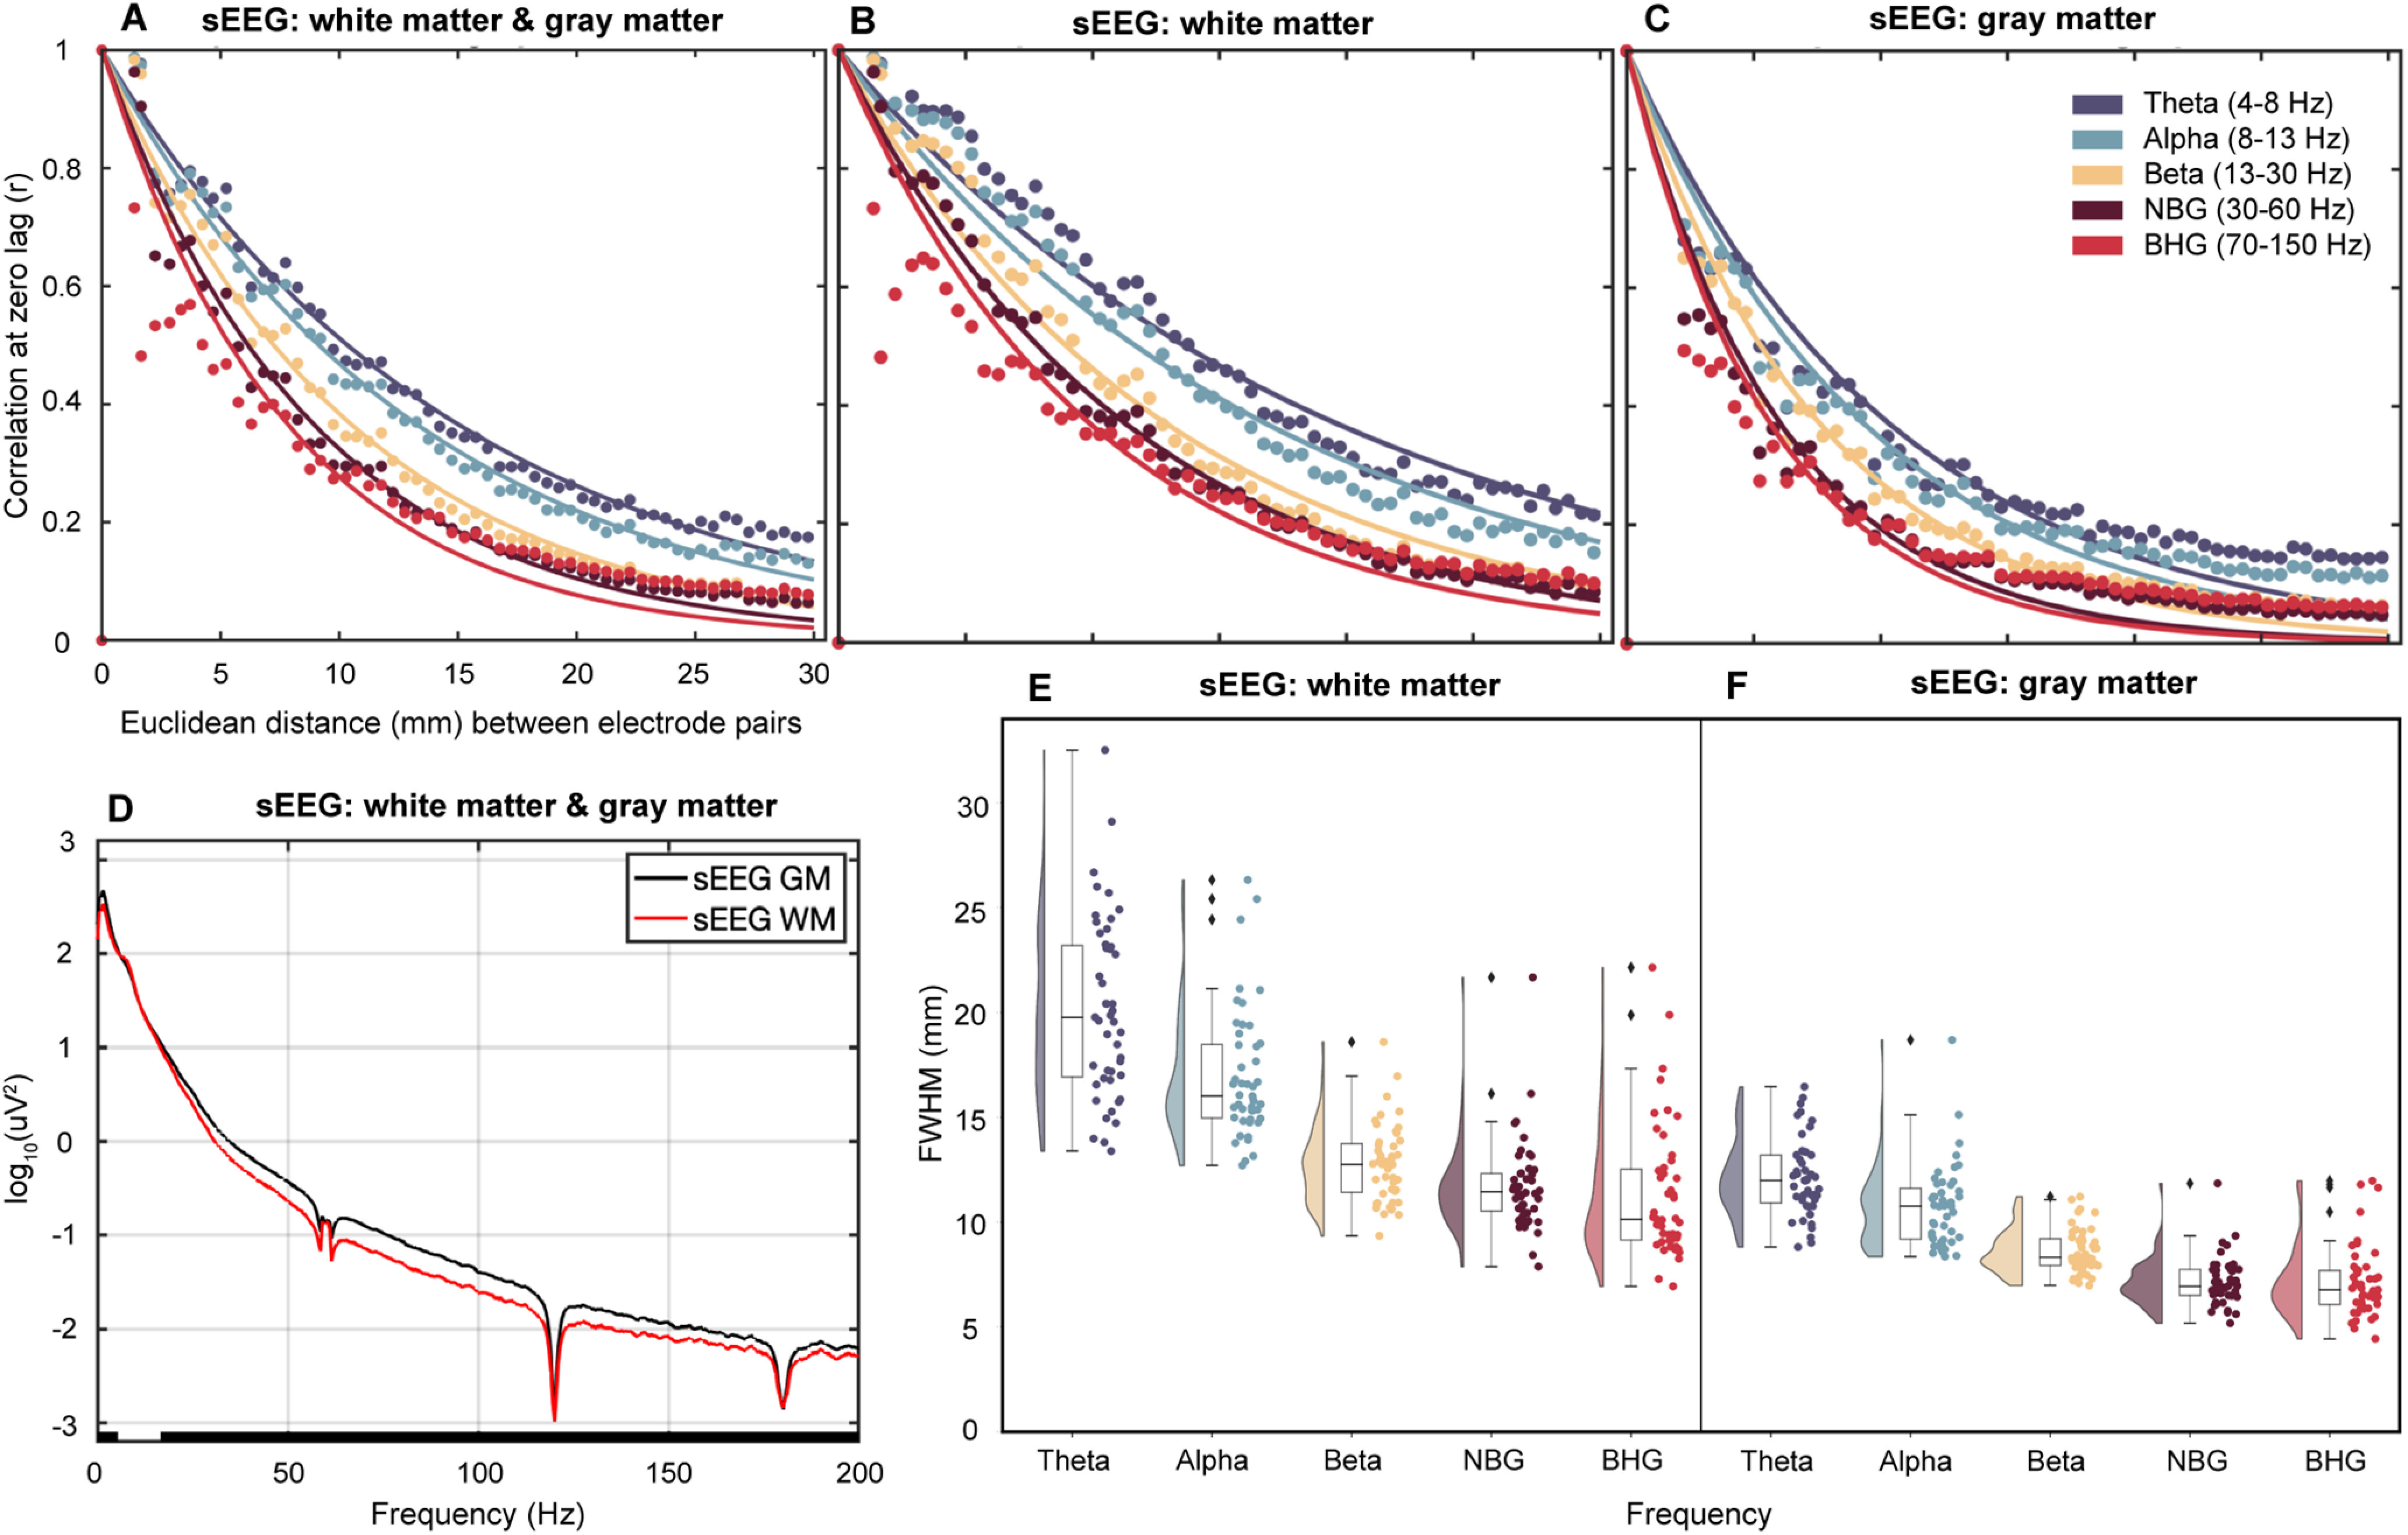
Figure 3.

Anatomical location of sEEG contacts in gray or white matter significantly influences FWHM correlation measures. Pearson’s correlation coefficient was measured between pairs of sEEG electrodes located in gray and white matter (A; 47 patients; 6757 electrodes; 244,621 electrode pairs), white matter only (B; 2649 electrodes; 43,957 electrode pairs), or gray matter only (C; 2916 electrodes; 47,522 electrode pairs). Each data point is binned into 0.5 mm bins based on distance between electrode pairs, colored based on frequency range of interest and fit with an exponential decay function shown as colored solid lines. D, Mean PSD plots for sEEG electrodes located in white matter (WM; red; 2649 electrodes) or gray matter (GM; black; 2916 electrodes). Notch filters were applied at 60 Hz and harmonics. Results from Wilcoxon sign-rank test with significance threshold of <0.01 denoted by black bar along the x-axis. Raincloud plots depicting FWHM values for each patient in each frequency range for all pairs of white matter located (E; 2649 electrodes; 43,957 electrode pairs) and gray matter located (F; 2916 electrodes; 47,522 electrode pairs) pairs. Frequency ranges of interest: θ (4–8 Hz), α (8–13 Hz), β (13–30 Hz), NBG (30–60 Hz), BHG (70–150 Hz). NBG, narrowband γ; BHG, broadband high γ.
