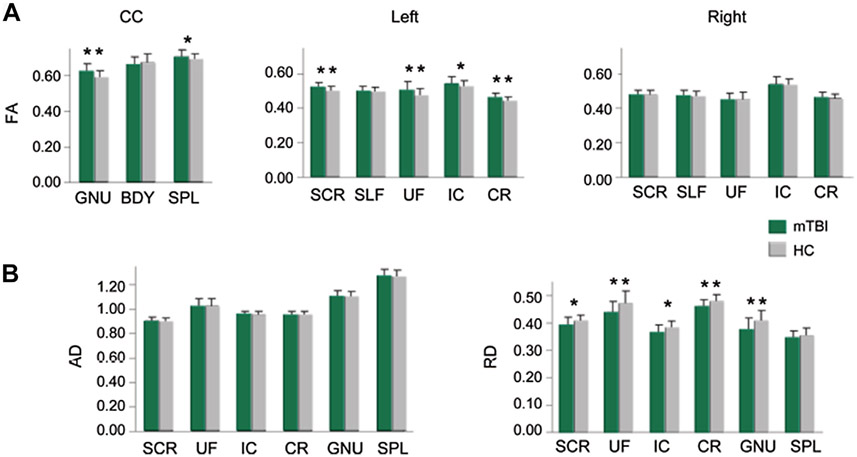
Fig. 2.
Mean FA values (A) from ROI in the genu (GNU), body (BDY), and splenium (SPL) of the corpus callosum (CC), superior corona radiata (SCR), superior longitudinal fasciculus (SLF), uncinate fasciculus (UF), corona radiata (CR), and internal capsule (IC). Patients with mTBI (green bars) showed mostly higher FA values than healthy controls (gray bars). Significance is indicated with double asterisks, statistical trends with single asterisk. Axial diffusivity and radial diffusivity (B) measurements from mTBI patients and healthy controls for regions with statistical differences in FA. (From Mayer AR, Ling J, Mannell MV, et al. A prospective diffusion tensor imaging study in mild traumatic brain injury. Neurology 2010;74(8):643–50; with permission.)

