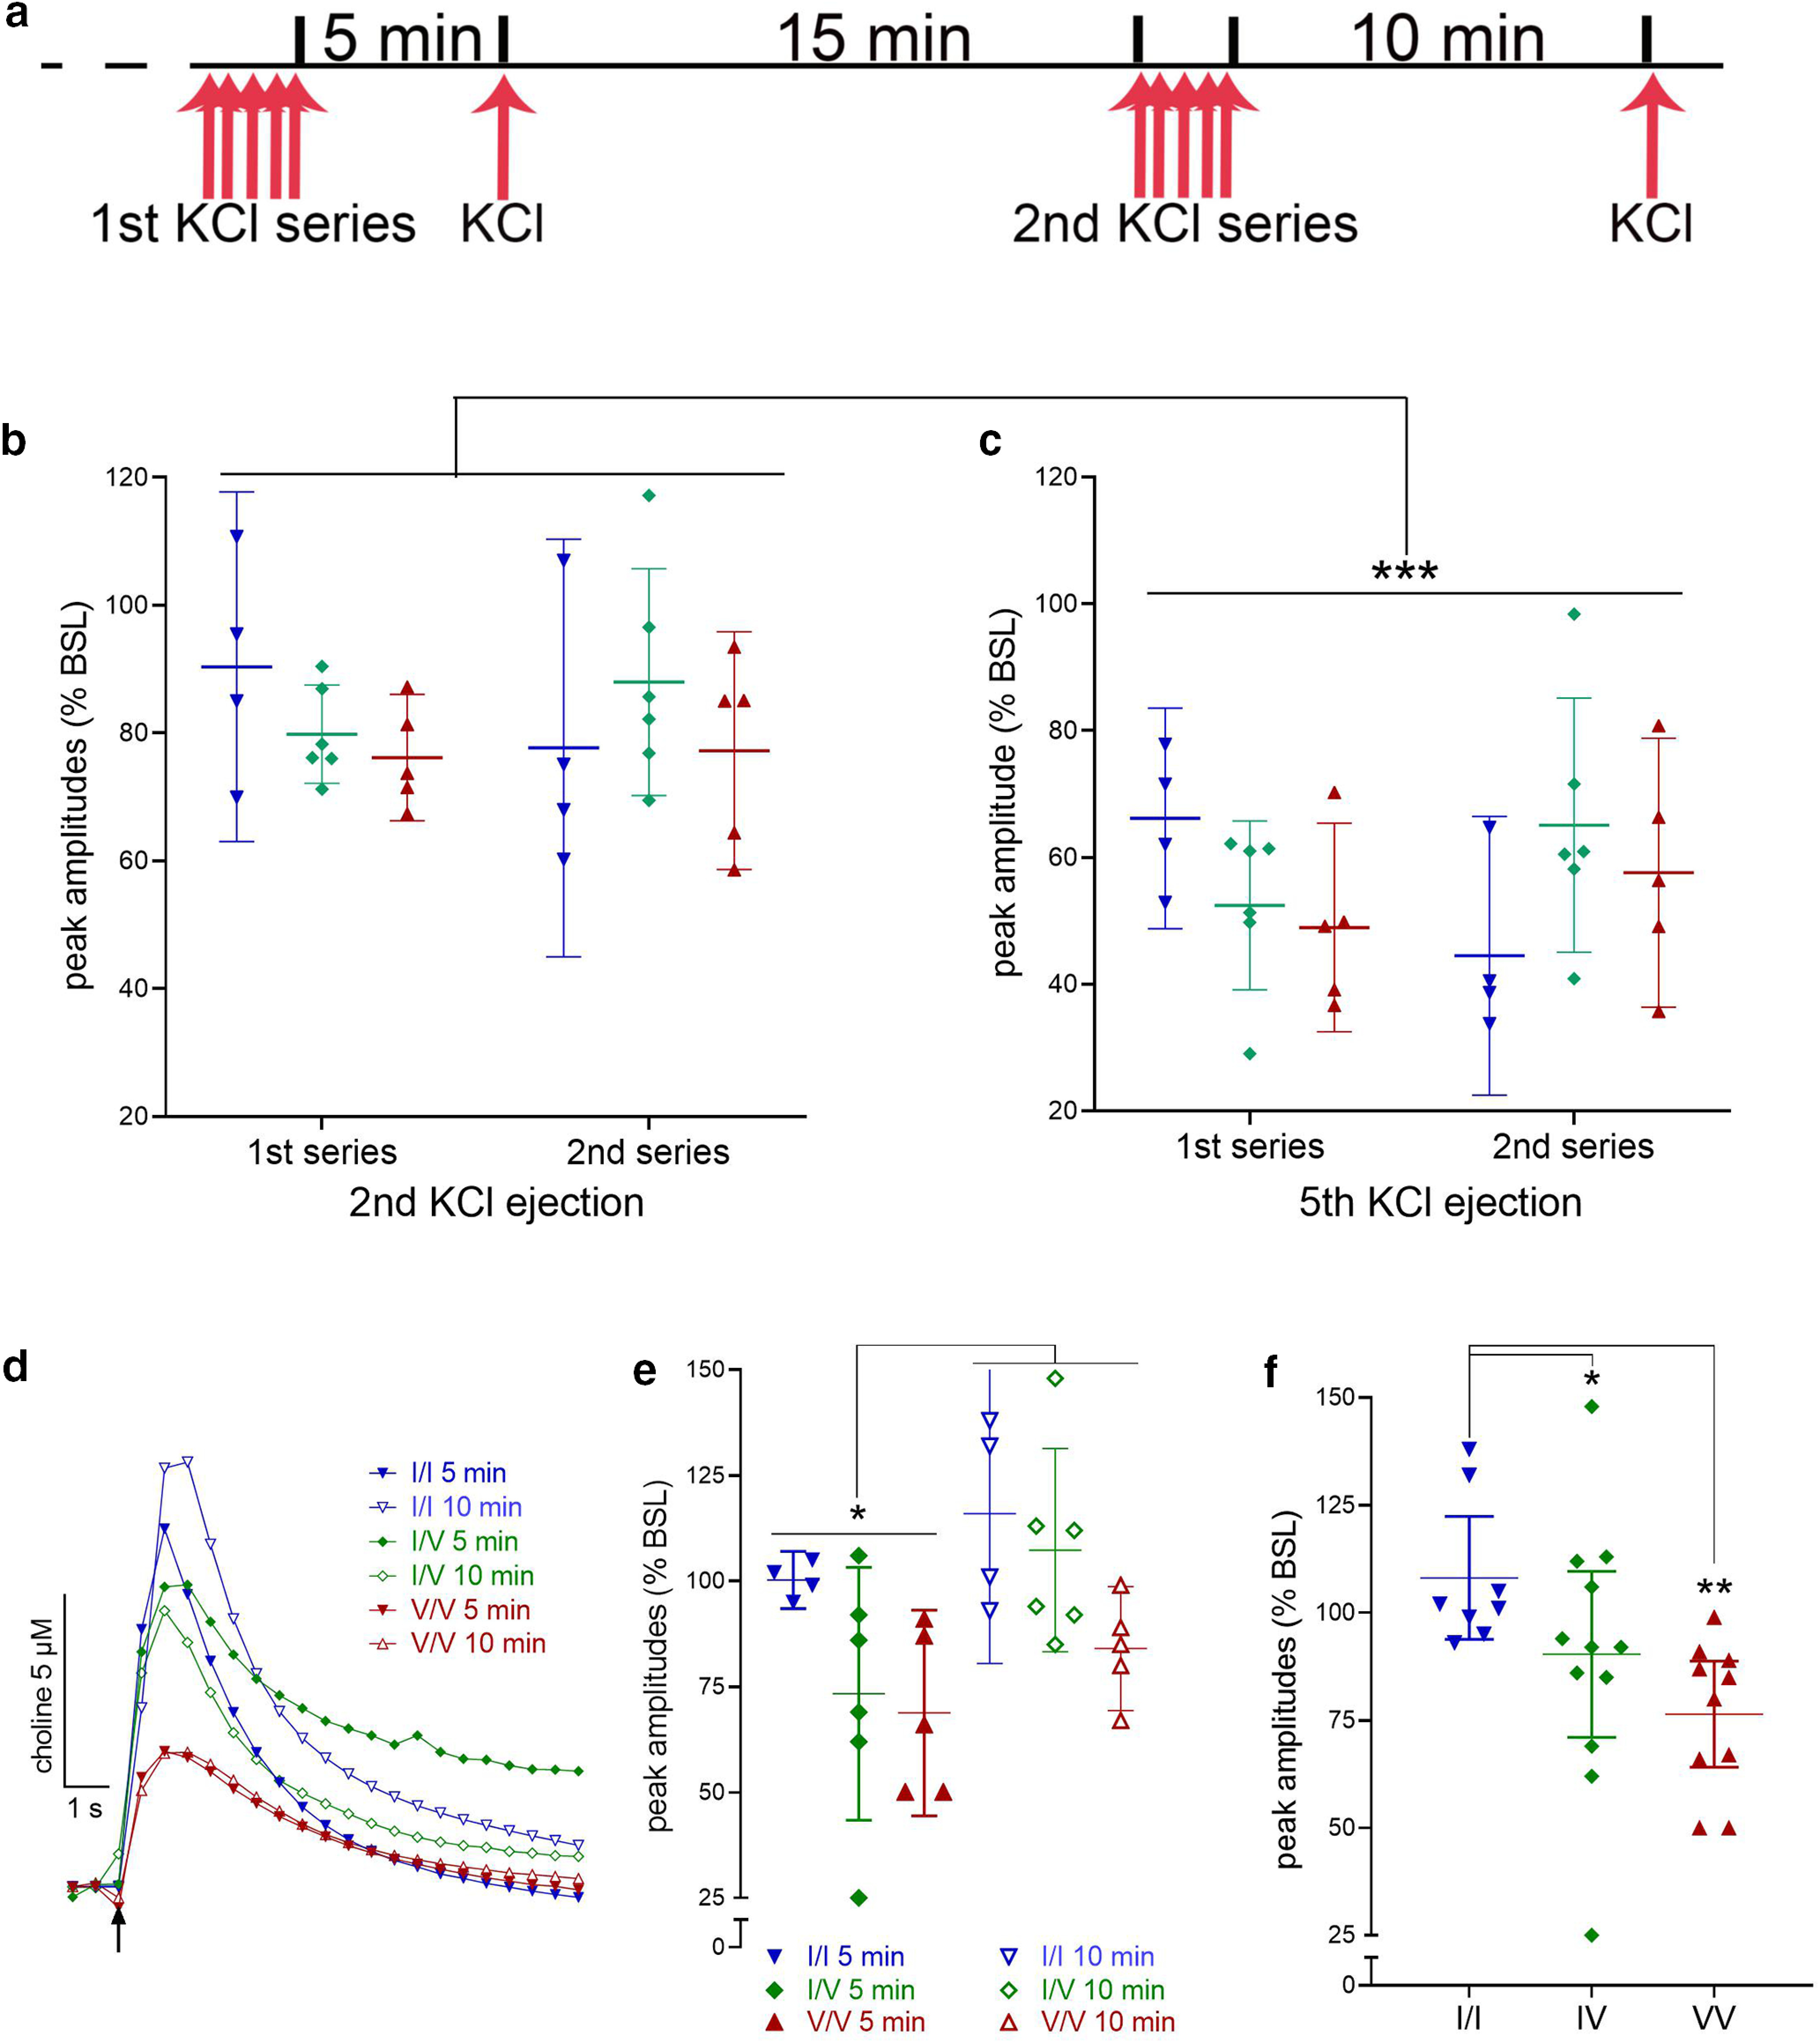
Figure 5.

Impact of CHT Val89 on ACh release capacity following repeated depolarization. a, Schematic illustration of the timeline of potassium chloride (KCl) pressure ejections. Following a period of calibration, an initial train of five KCl ejections were administered over 2 min and followed, 5 min later, by a first release capacity test. After a 15-min pause, a second series of depolarizations was followed, 10 min later, by a second release capacity test. Peak amplitude currents following the first KCl ejection of either series did not vary by genotype (data not shown). b, c, Peak amplitudes of currents evoked by the second and fifth ejection, respectively, of either series, expressed as a ratio of the amplitudes of the first ejection (BSL; n = 4 WT, 6 CHT I/V, and 5 CHT V/V mice; lines and bars in b, c, e, f depict means and 95% CI). Compared with the second depolarization, the fifth resulted in significantly smaller amplitudes across genotypes and the two series. d, Representative traces of currents evoked at the 5- and 10-min recovery tests, illustrating attenuated ACh release in CHT I/V and CHT V/V mice. e, Peak amplitudes of the recovery currents, expressed as the percent of the amplitude of the first depolarization of the respective series (baseline, BSL), indicated significantly greater recovery after the longer 10-min pause compared with peak currents recorded 5 min after the depolarization train (see Results for ANOVA). The analysis of the effects of series and genotype also revealed a main effect of genotype, illustrated in f, that reflected significantly lower peak amplitudes in CHT I/V (12 ejections from n = 6) and CHT V/V (10 ejections from n = 5) mice relative to peak amplitudes in WT mice (8 ejections from n = 4; LSD test; see f for post hoc multiple comparisons; b, c, e, f show means and 95% confidence intervals).
