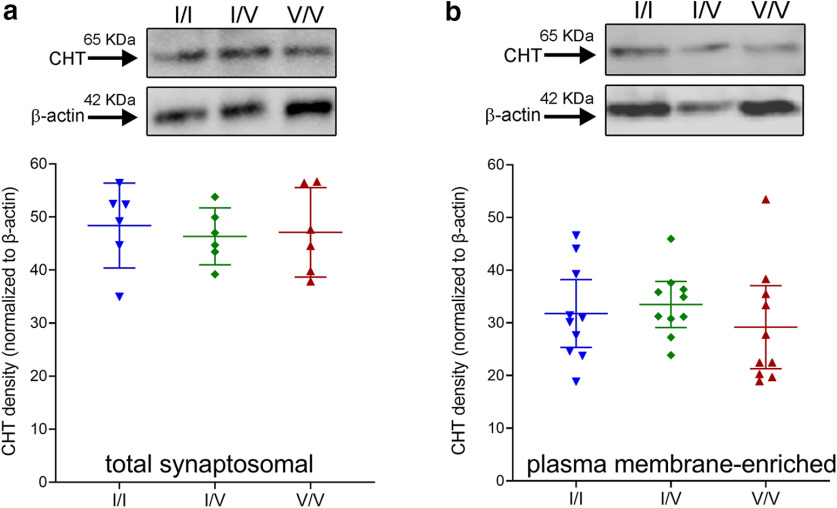
Figure 6.
Top, Western blottings showing the presence of the CHT in frontal cortical total synaptosomal lysates (a, top) and synaptosomal plasma-membrane-enriched fractions (b, top; normalized against β-actin; each lane is based on tissue from one individual; 25-µg protein loaded in each well; total and plasma membrane-enriched fractions were derived from separate groups of mice). CHT densities in neither total lysates (a) nor plasma membrane-enriched fractions (b) differed between the genotypes (graphs show individual values, means and 95% confidence intervals (CI)).

