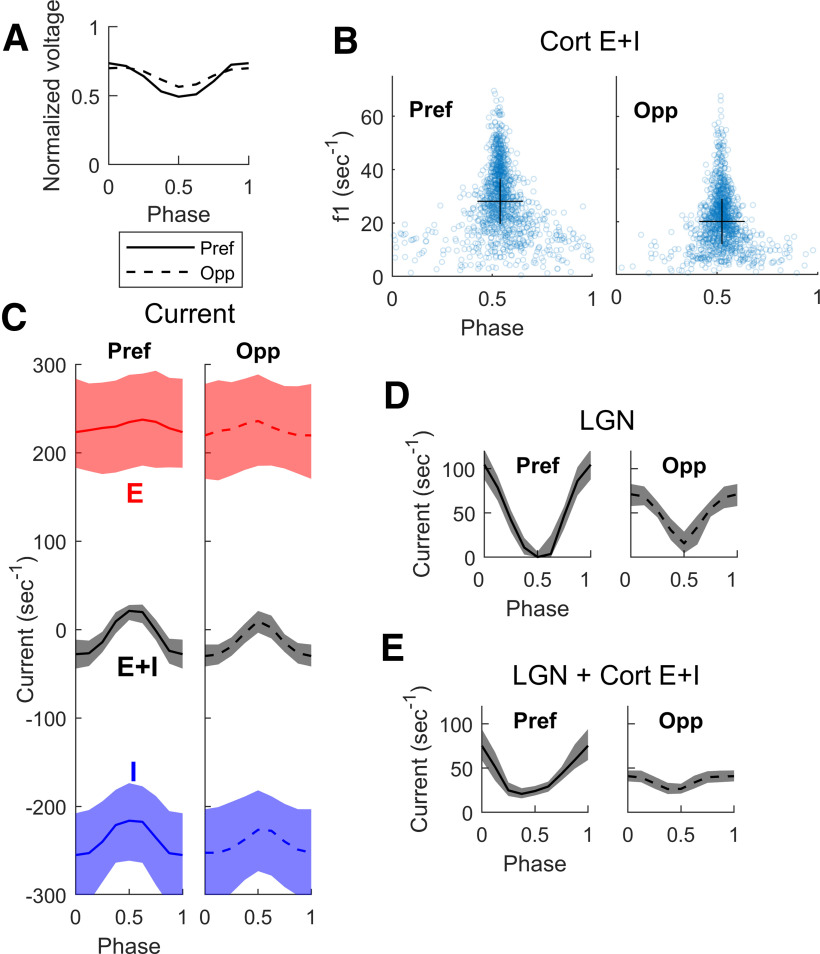
Figure 10.
Membrane potential and cortical currents as function of LGN phase in the DSV1 model. Same cell population, stimuli and notation as in Figure 9. A, Median modulation of membrane potential in Pref (solid) and Opp (dashed) directions. B, The amplitude of the f1 component of net cortical synaptic current (E + I) plotted versus the phase (fraction of a cycle) of the E + I current with respect to the phase of LGN input. Data plotted for the Pref and Opp directions, for each cell in the population. In both directions, the cortical currents are predominantly out of phase (phase ∼ 1/2 cycle) with LGN input. Crosses show medians for both x- and y-axes. C, E and I synaptic currents versus phase with respect to LGN, in both Pref and Opp directions. E plotted in red, I in blue; medians and quartiles plotted for each. Gray curves and shaded regions are medians and quartiles of the net cortical current, E + I. D, LGN excitatory current versus phase with respect to its peak, for Pref and Opp directions. Medians and quartiles plotted as in C. E, Sum of LGN and cortical currents, plotted versus phase with respect to LGN.

