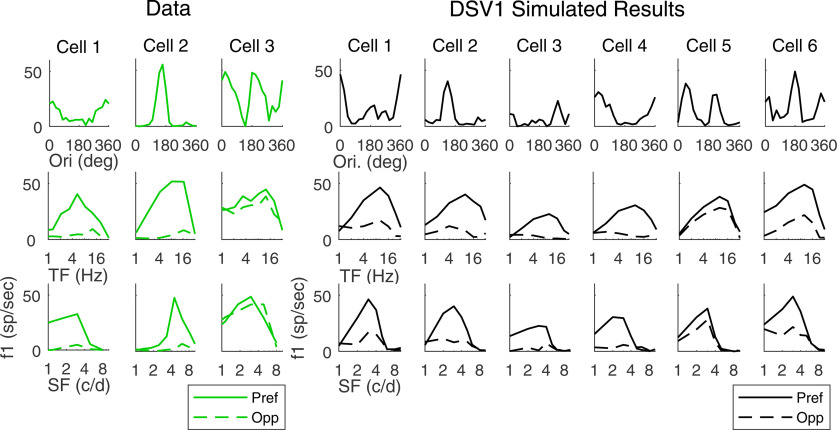
Figure 5.
DS properties of single cells from experimental data and model output. Tuning curves of three recorded V1 simple cells (left) and six model simple cells (right) are shown. Top, Orientation tuning curves at optimal TF, SF. Middle, Reponses in Pref and Opp directions versus TF. Bottom, Reponses in Pref and Opp directions versus SF.

