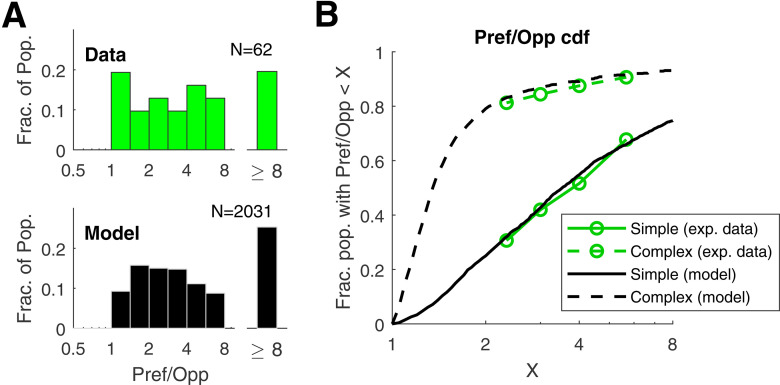
Figure 7.
Population statistics of DS in model V1 neurons and comparison with V1 data. A, Distribution of DS in model and data for Simple cells. The plots show the distributions of Pref/Opp in model and data for Simple cells for the <Ori, SF, TF> combination that produced maximum f1 response. The data histogram is plotted in green; the model histogram is plotted in black. B, Cumulative distribution functions (CDFs) of Pref/Opp shown for Simple and Complex populations for data (green) and model (black).

