
Figure 4.
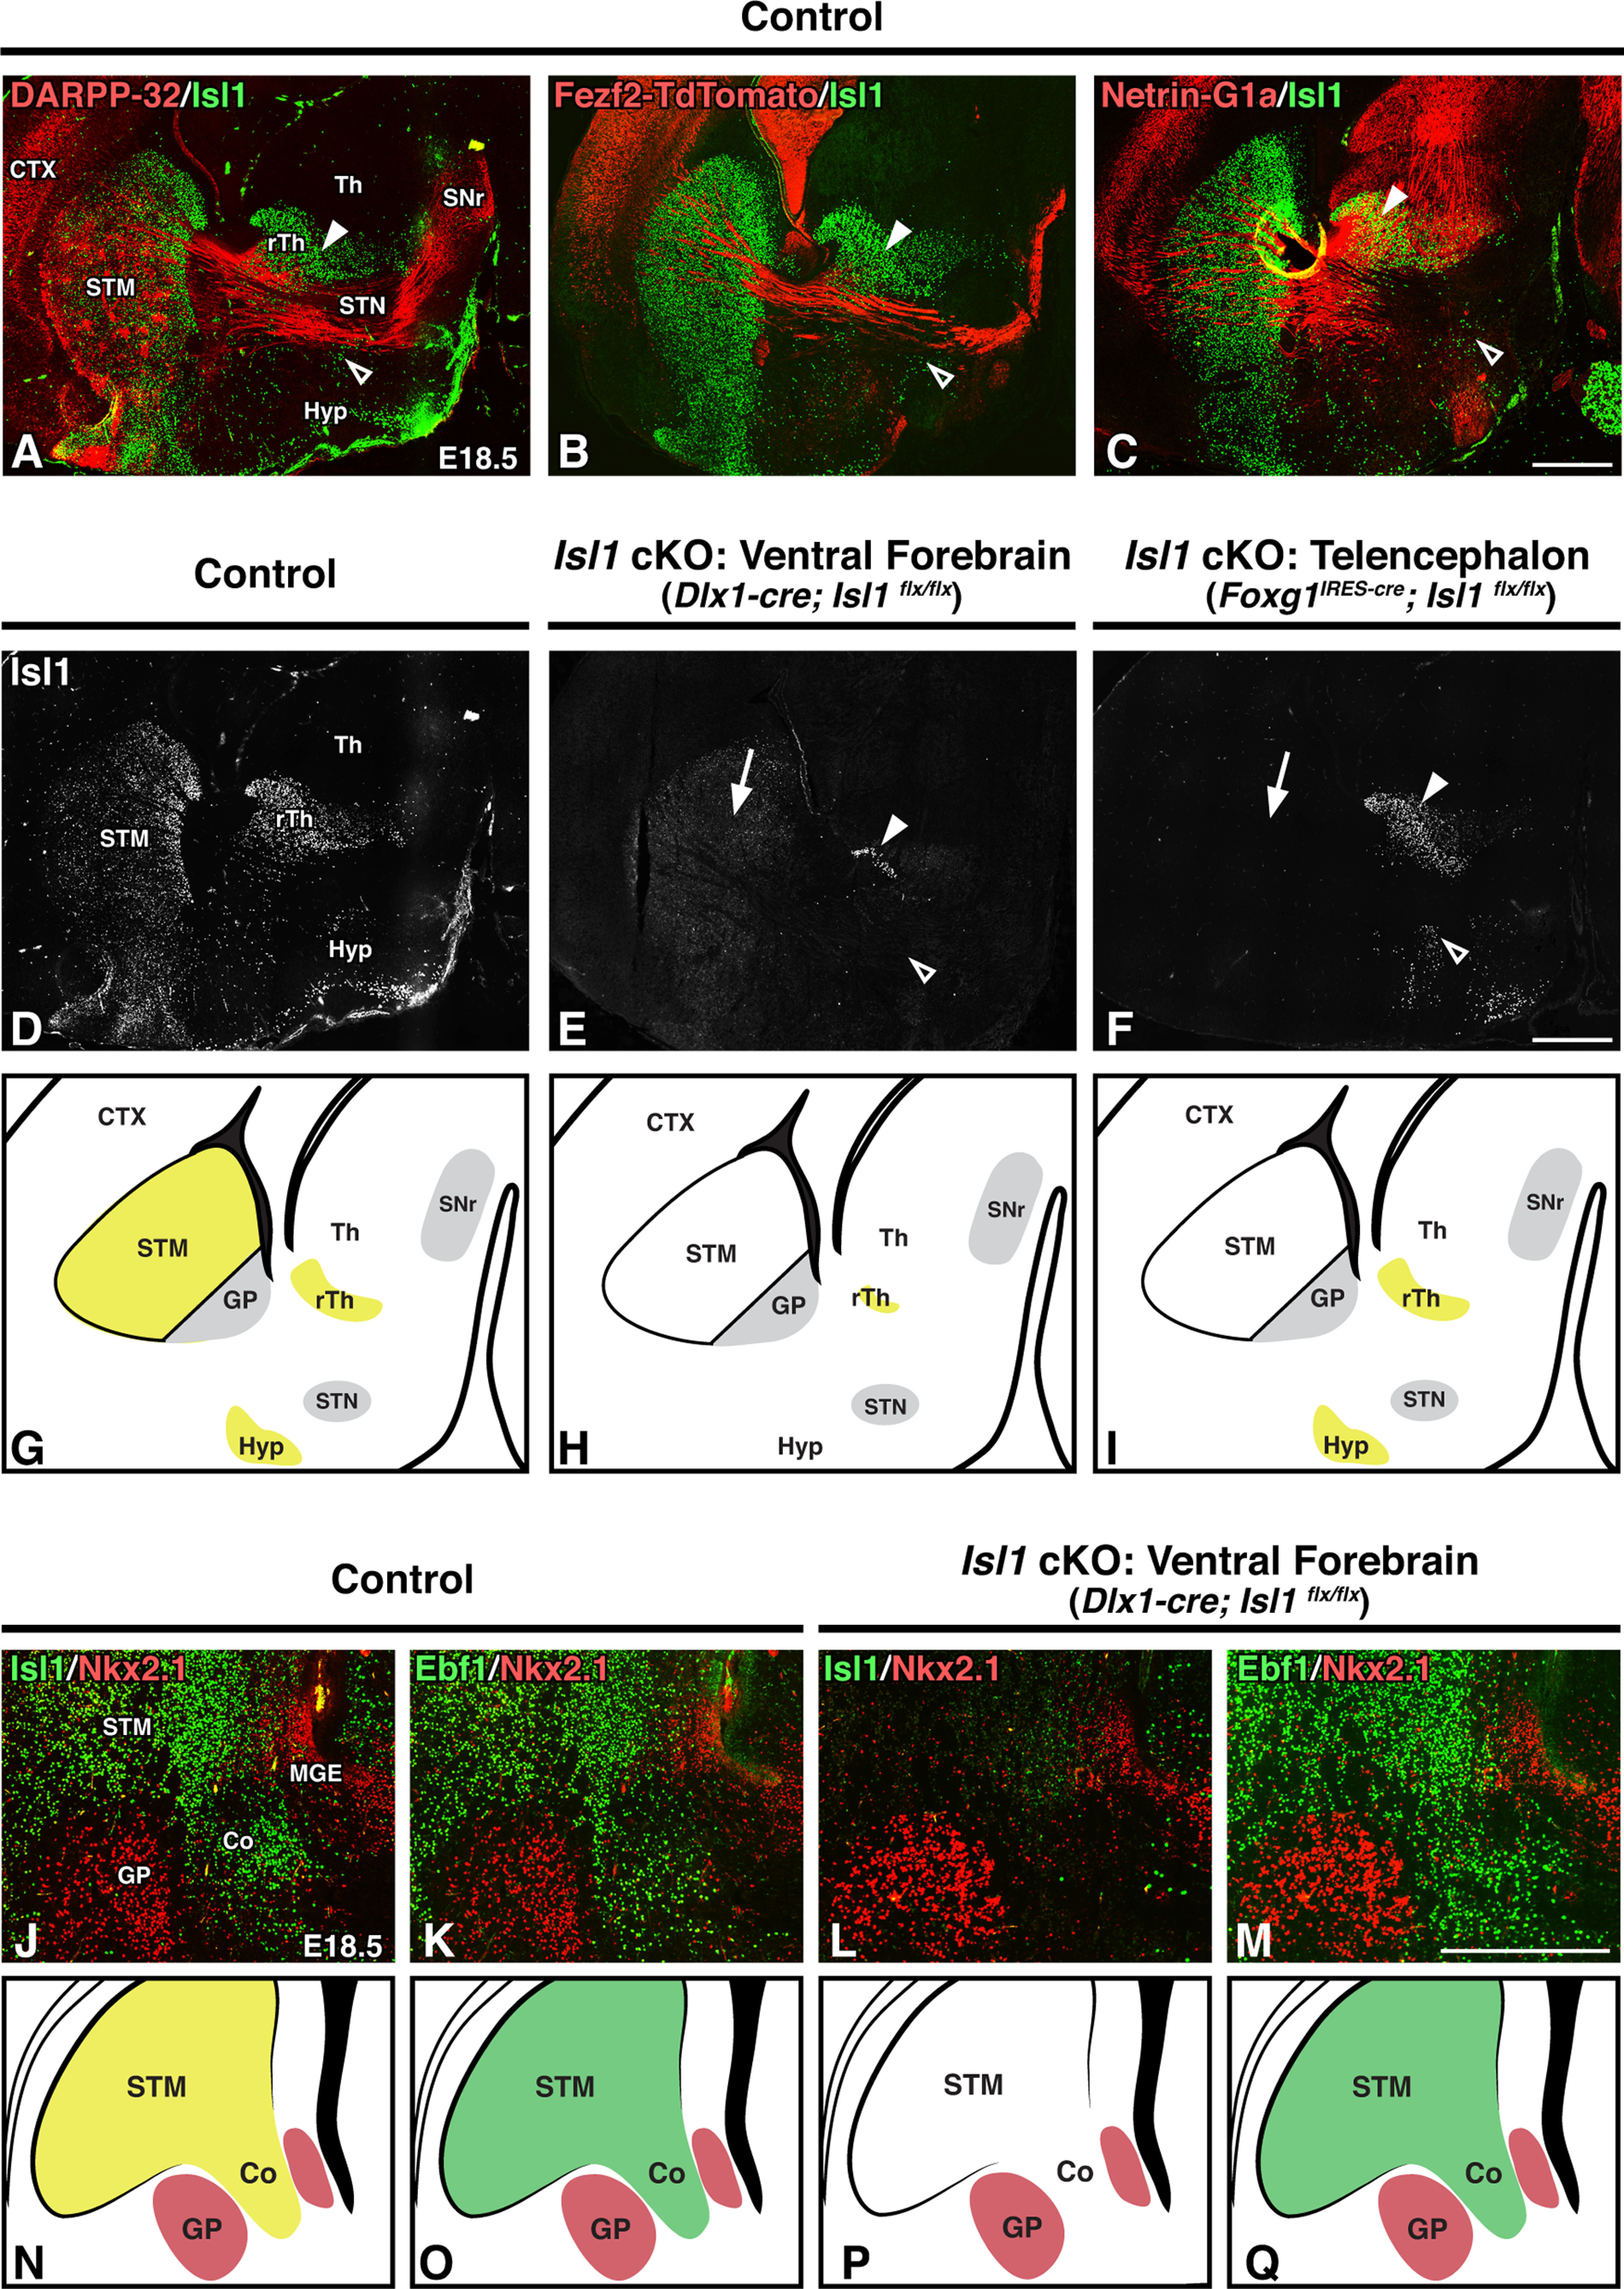
Telencephalon-specific inactivation of Isl1 removes Isl1 expression from the STM but spares Isl1 expression within diencephalic populations bordering the internal capsule. A–F, Sagittal brain sections of E18.5 controls (Dlx1-cre; Isl1flx/+; Fezf2-TdTomato or Foxg1IRES-cre; Isl1flx/+; Fezf2-TdTomato, n = 6; A–D), ventral forebrain-specific Isl1 cKOs (Dlx1-cre; Isl1flx/flx; Fezf2-TdTomato, n = 3; E), and telencephalon-specific Isl1 cKOs (Foxg1IRES-cre; Isl1flx/flx; Fezf2-TdTomato, n = 3; F). Double-labeling with Isl1 and DARPP-32 to mark striatal projections (A), Fezf2-TdTomato to mark descending corticofugal projections (B), or Netrin-G1a to mark ascending thalamocortical projections (C). Isl1-positive populations within the rTh and Hyp (A, B, C, arrowheads) border axon projections as they extend through the internal capsule/cerebral peduncle. Isl1 single-labeling (D, E, F) shows that both Dlx1-cre and Foxg1-cre drivers delete Isl1 expression in the STM (E, F, arrows), but only the Dlx1-cre driver efficiently removes Isl1 expression from the Hyp (E, F, open arrowheads) and rTh (E, F, solid arrowheads). G–I, Cartoon diagrams comparing Isl1 expression (yellow) in controls (G), ventral forebrain-specific Isl1 cKOs (H), and telencephalon-specific Isl1 cKOs (I). J–M, Coronal brain sections of E18.5 controls (Dlx1-cre; Isl1 flx/+, n = 3; J, K) and ventral forebrain-specific Isl1 cKOs (Dlx1-cre; Isl1flx/flx, n = 3; L, M). Double-labeling with GP marker Nkx2.1 and either Isl1 (J, L) or Ebf1 (tyramide amplified; K, M) shows that corridor cells are appropriately located in Isl1 mutants. N–Q, Cartoon diagrams comparing Isl1 (N, P, yellow) and Ebf1 (O, Q, green) expression in controls (N, O) and ventral forebrain-specific Isl1 cKOs (P, Q). Co, Corridor; CTX, cortex; STM, striatum; Th, thalamus. Scale bars: A–F, 500 μm; J–M, 250 μm.