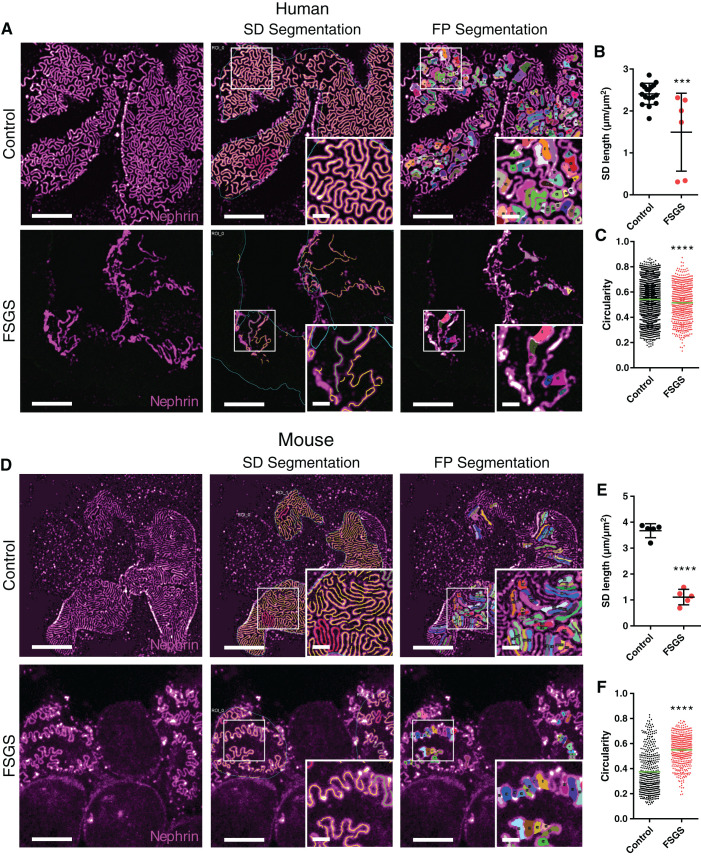
Figure 3.
Imaging and segmentation/morphometry of the SD/FP pattern in healthy and diseased human and murine FFPE tissue imaged with confocal microscopy. All samples were stained for nephrin using Alexa-488 and imaged using a 100× NA 1.4 oil objective with a confocal pinhole setting of 0.3 AU. Scale bars: 5 µm and 1 µm (zoomed insets). (A) Maximum intensity projections of z-stacks approximately 2-µm-thick, showing the global slit pattern in a control human sample and a sample from a patient diagnosed with FSGS. Insets are zooms of the area marked with a white square, showing effacement in higher detail. (B) SD length per capillary area in control and FSGS patients, showing a significant decrease for the FSGS patient. Each dot represents one image. Black line represents the mean, and error bars represent SD. Two-tailed t test, P=0.001. (C) FP circularity score for control and FSGS patients, showing an unexpected but significant decrease in circularity score for the FSGS patient. Each dot represents one FP, and the green line represents the mean. Two-tailed t test, P<0.0001. (D) Maximum intensity projections of z-stacks approximately 2-µm-thick, showing the global SD pattern in a wild-type (WT) murine sample and a sample from a mouse with genetic FSGS. Insets show zooms of the area marked with a white square, showing effacement of FP in the FSGS mouse in higher detail. (E) SD length per capillary area in WT and FSGS mice, showing a significant decrease for the mutated mouse. Each dot represents one image. Black line represents the mean, and error bars represent SD. Two-tailed t test, P<0.0001. (F) FP circularity score for WT and FSGS mice, showing a significant increase in circularity score for the FSGS mouse. Each dot represents one FP, and the green line represents the mean. Two-tailed t test, P<0.0001.

