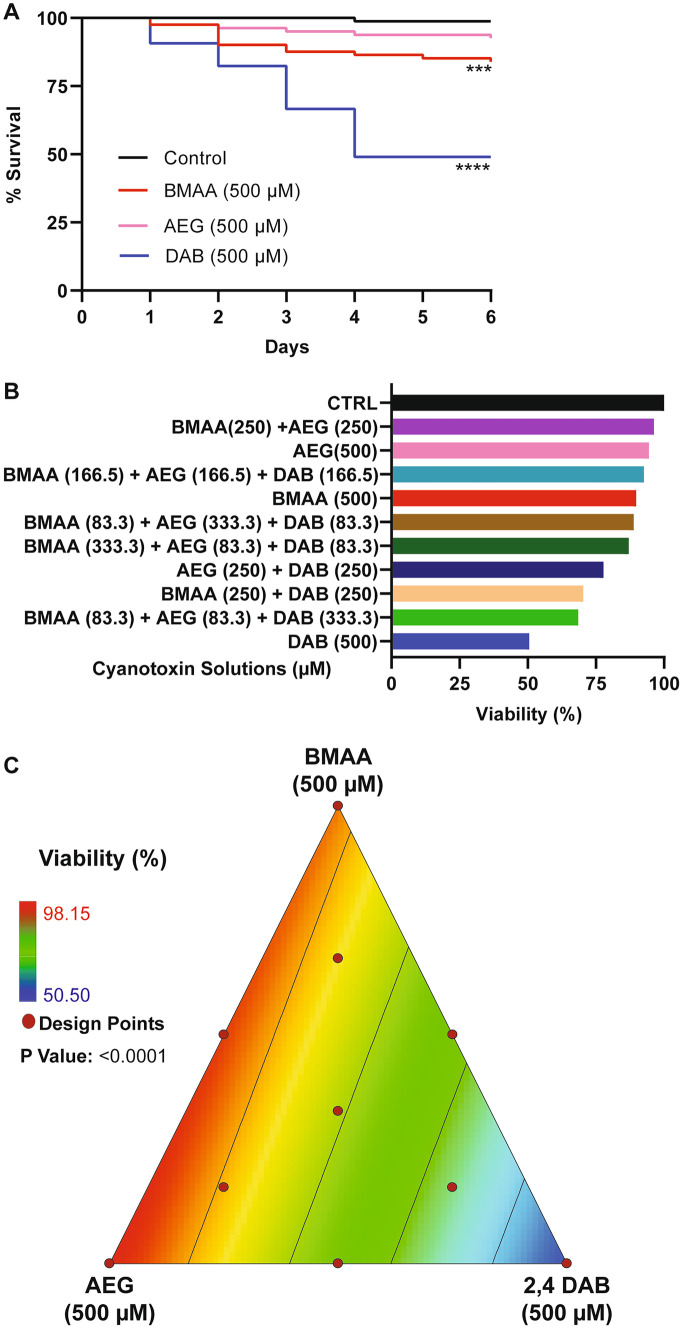
Fig. 2.
Viability assessment. A Kaplan–Meier cumulative survival plots comparing percent survival between four treatment groups: Control (n = 108), BMAA (n = 162), AEG (n = 162), and 2,4-DAB (n = 108) (P < 0.001, Mantel-Cox log-rank test). B Bar graph representing percent viability across all treatment groups. C 2D contour plot representing zebrafish percent viability in response to each mixture of BMAA, AEG, and 2,4-DAB (Linear regression model, P < 0.0001)

