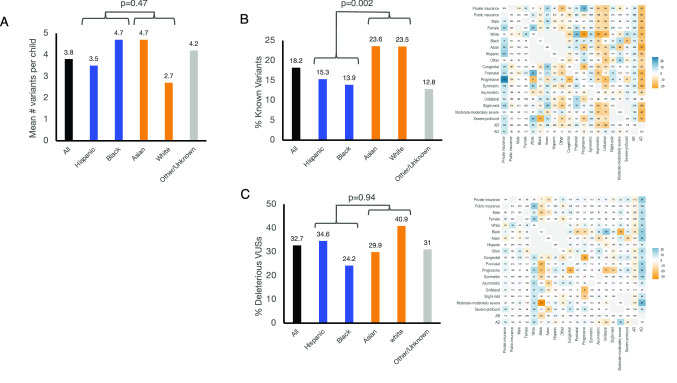
Fig. 3.
Variant distribution. A. Mean number of variants identified per child across race/ethnicity groups with reported p-value of ANOVA for mean number of variants vs dichotomized race/ethnicity (White/Asian and Black/Hispanic). B. Known Variant rate. Left: Distribution of Known Variants across race/ethnicity groups. Known Variant rate was compared by ANOVA between dichotomized race/ethnicity groups (White/Asian and Black/Hispanic). Right: Distribution of Known Variants across characteristics is shown. Color scheme is as described in Fig 2. C. Predicted deleterious VUS rate. Left: Distribution of predicted deleterious VUSs (by PROVEAN prediction) across race/ethnicity groups. Deleterious VUS rate was compared by ANOVA between dichotomized race/ethnicity groups (White/Asian and Black/Hispanic). Right: Distribution of deleterious VUSs across characteristics is shown. Color scheme is as described in Fig 2

