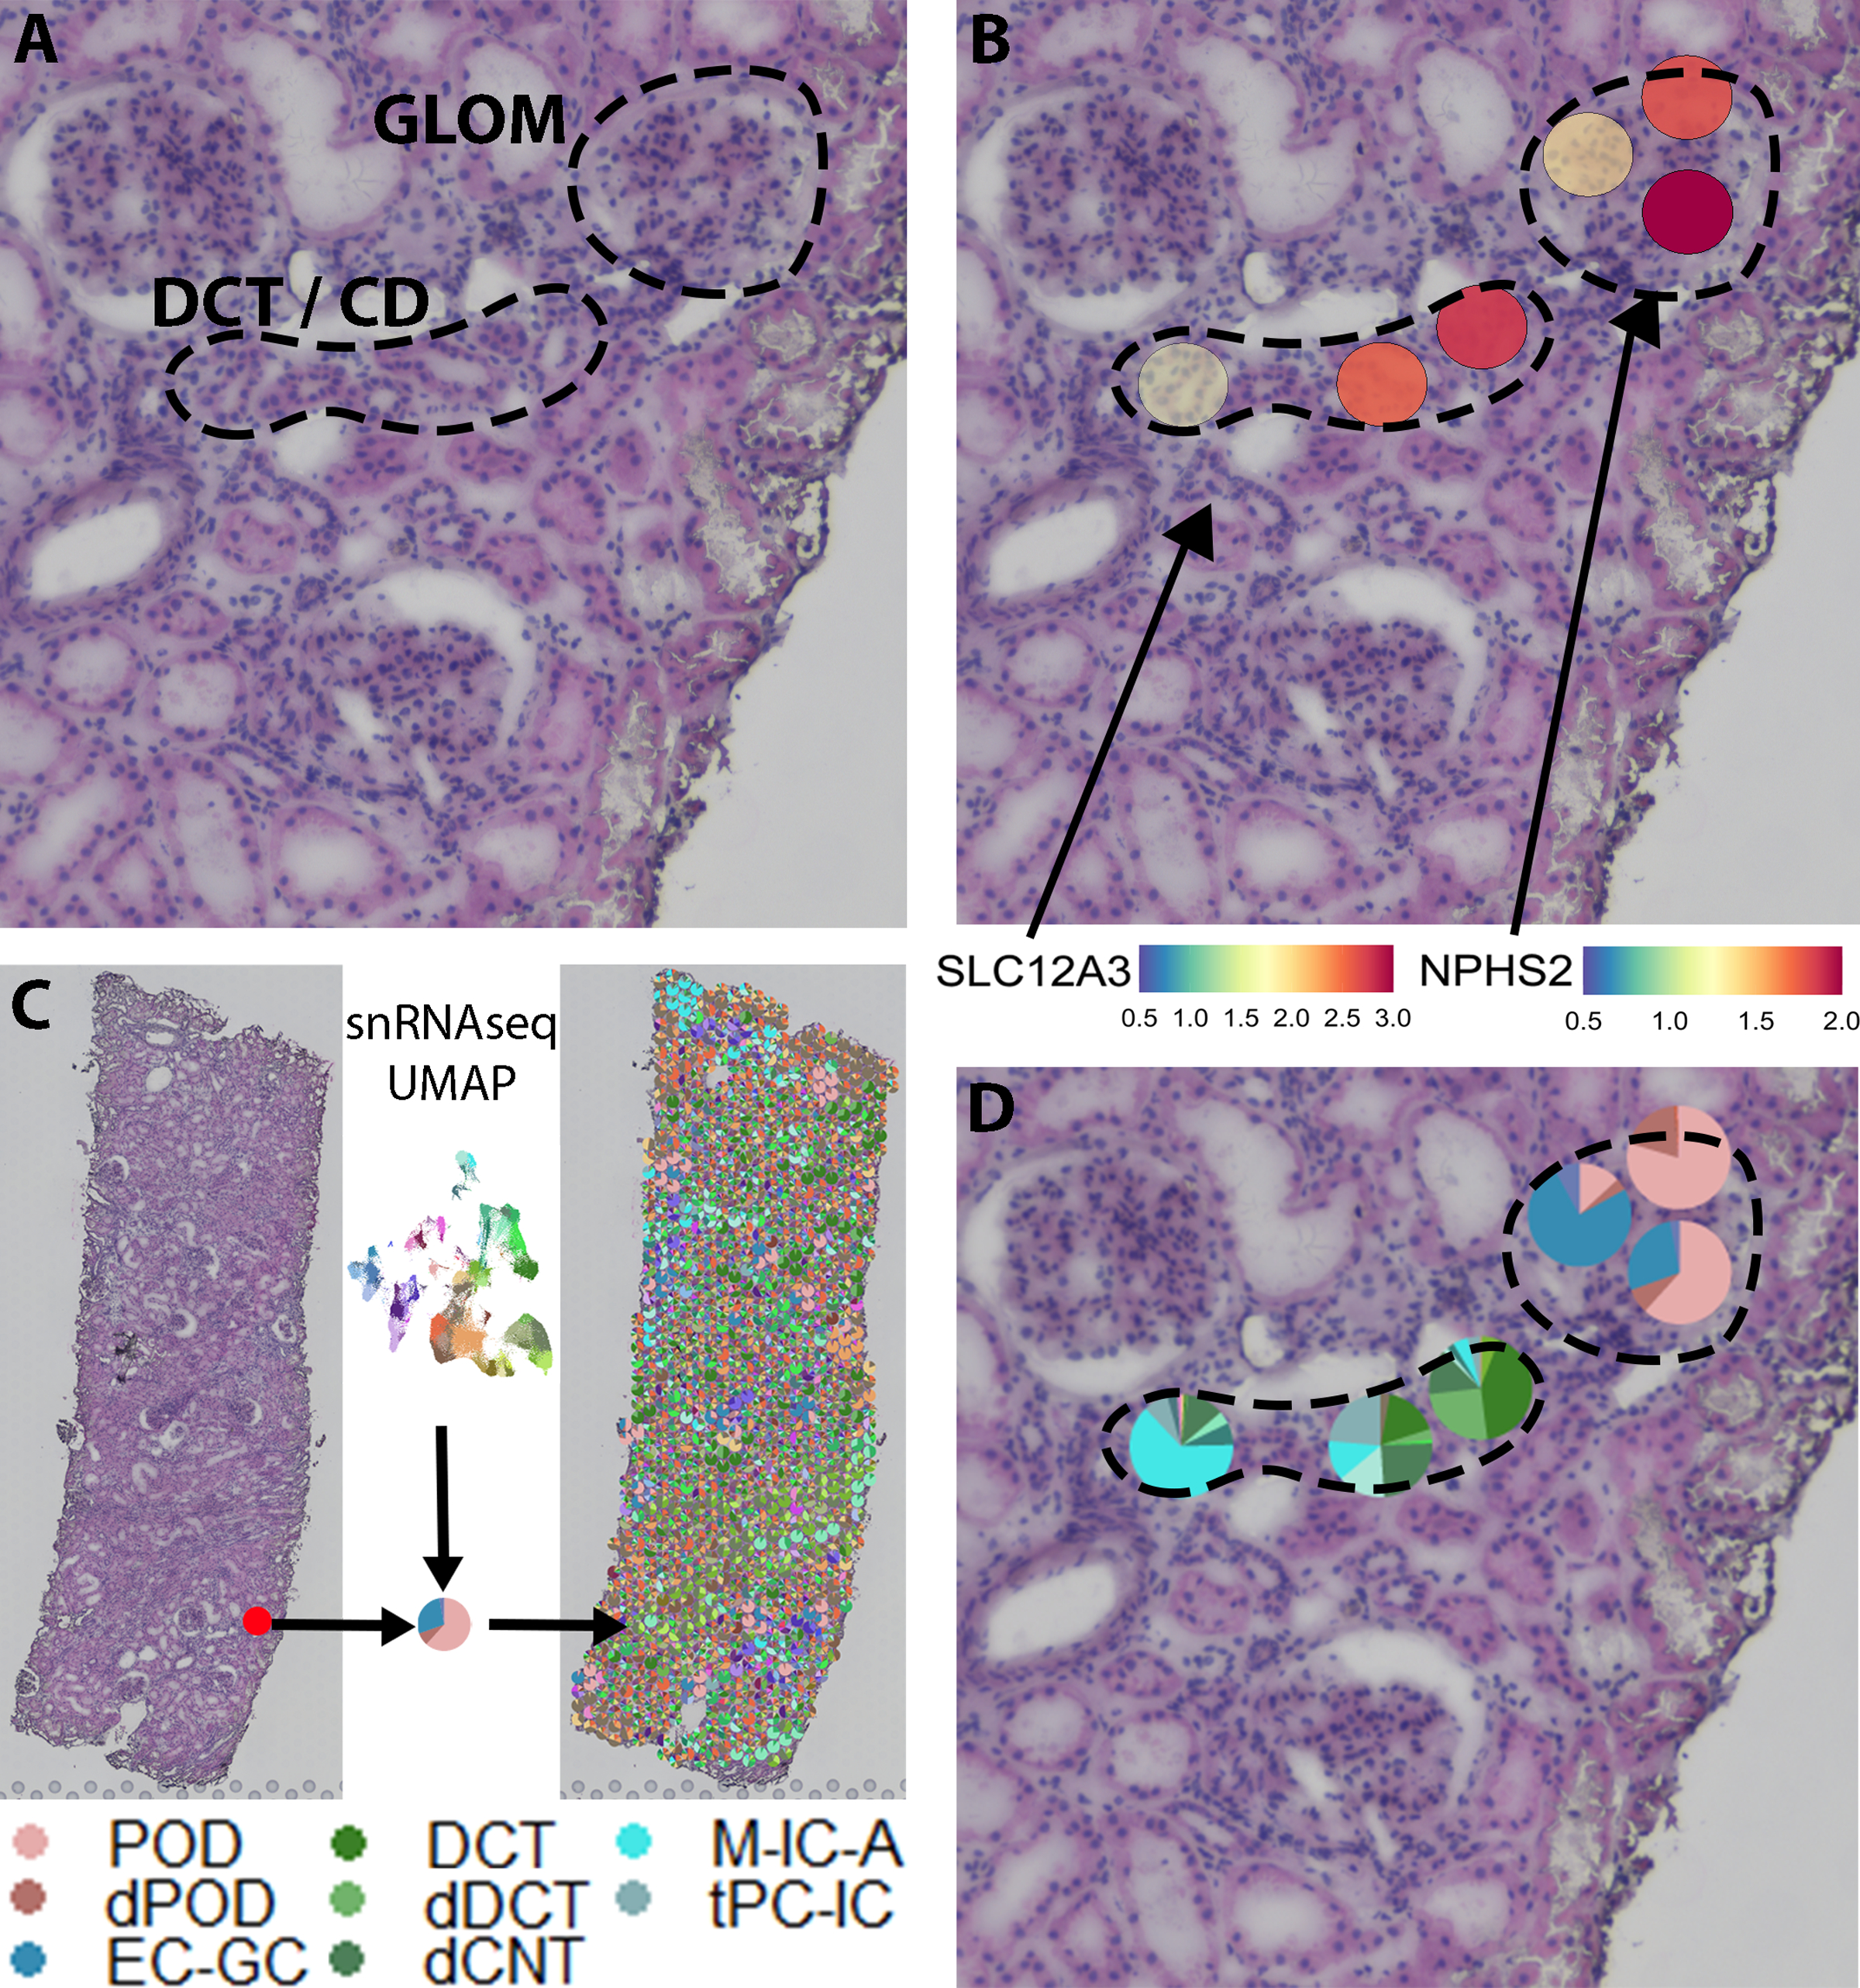
Figure 1: Cell type mapping in spatial transcriptomics.

A) H+E image with a glomerulus and a transition from the distal tubule (DCT) into a collecting duct (CD). B) Podocin (NPHS2) is expressed in the glomerulus. The thiazide sensitive sodium chloride cotransporter (SLC12A3) expression decreases from right to left as the DCT transitions to CD. C) Schematic indicating that transfer scores are calculated for >100 snRNAseq clusters based on all genes expressed and then mapped onto the spatial transcriptomics sample in Seurat version 3, deconvoluting the proportion of expression in each spot corresponding to a snRNAseq cluster. D) Glomerular spots contain signature from podocytes (POD) and glomerular endothelial cells (EC-GC). Damaged POD (dPOD = cell state) signature is also seen. From right to left, a gradual transition is seen from DCT and connecting tubule (CNT) signatures to CD intercalated (MIC-A) and principal cell (tPC-IC) signatures.
