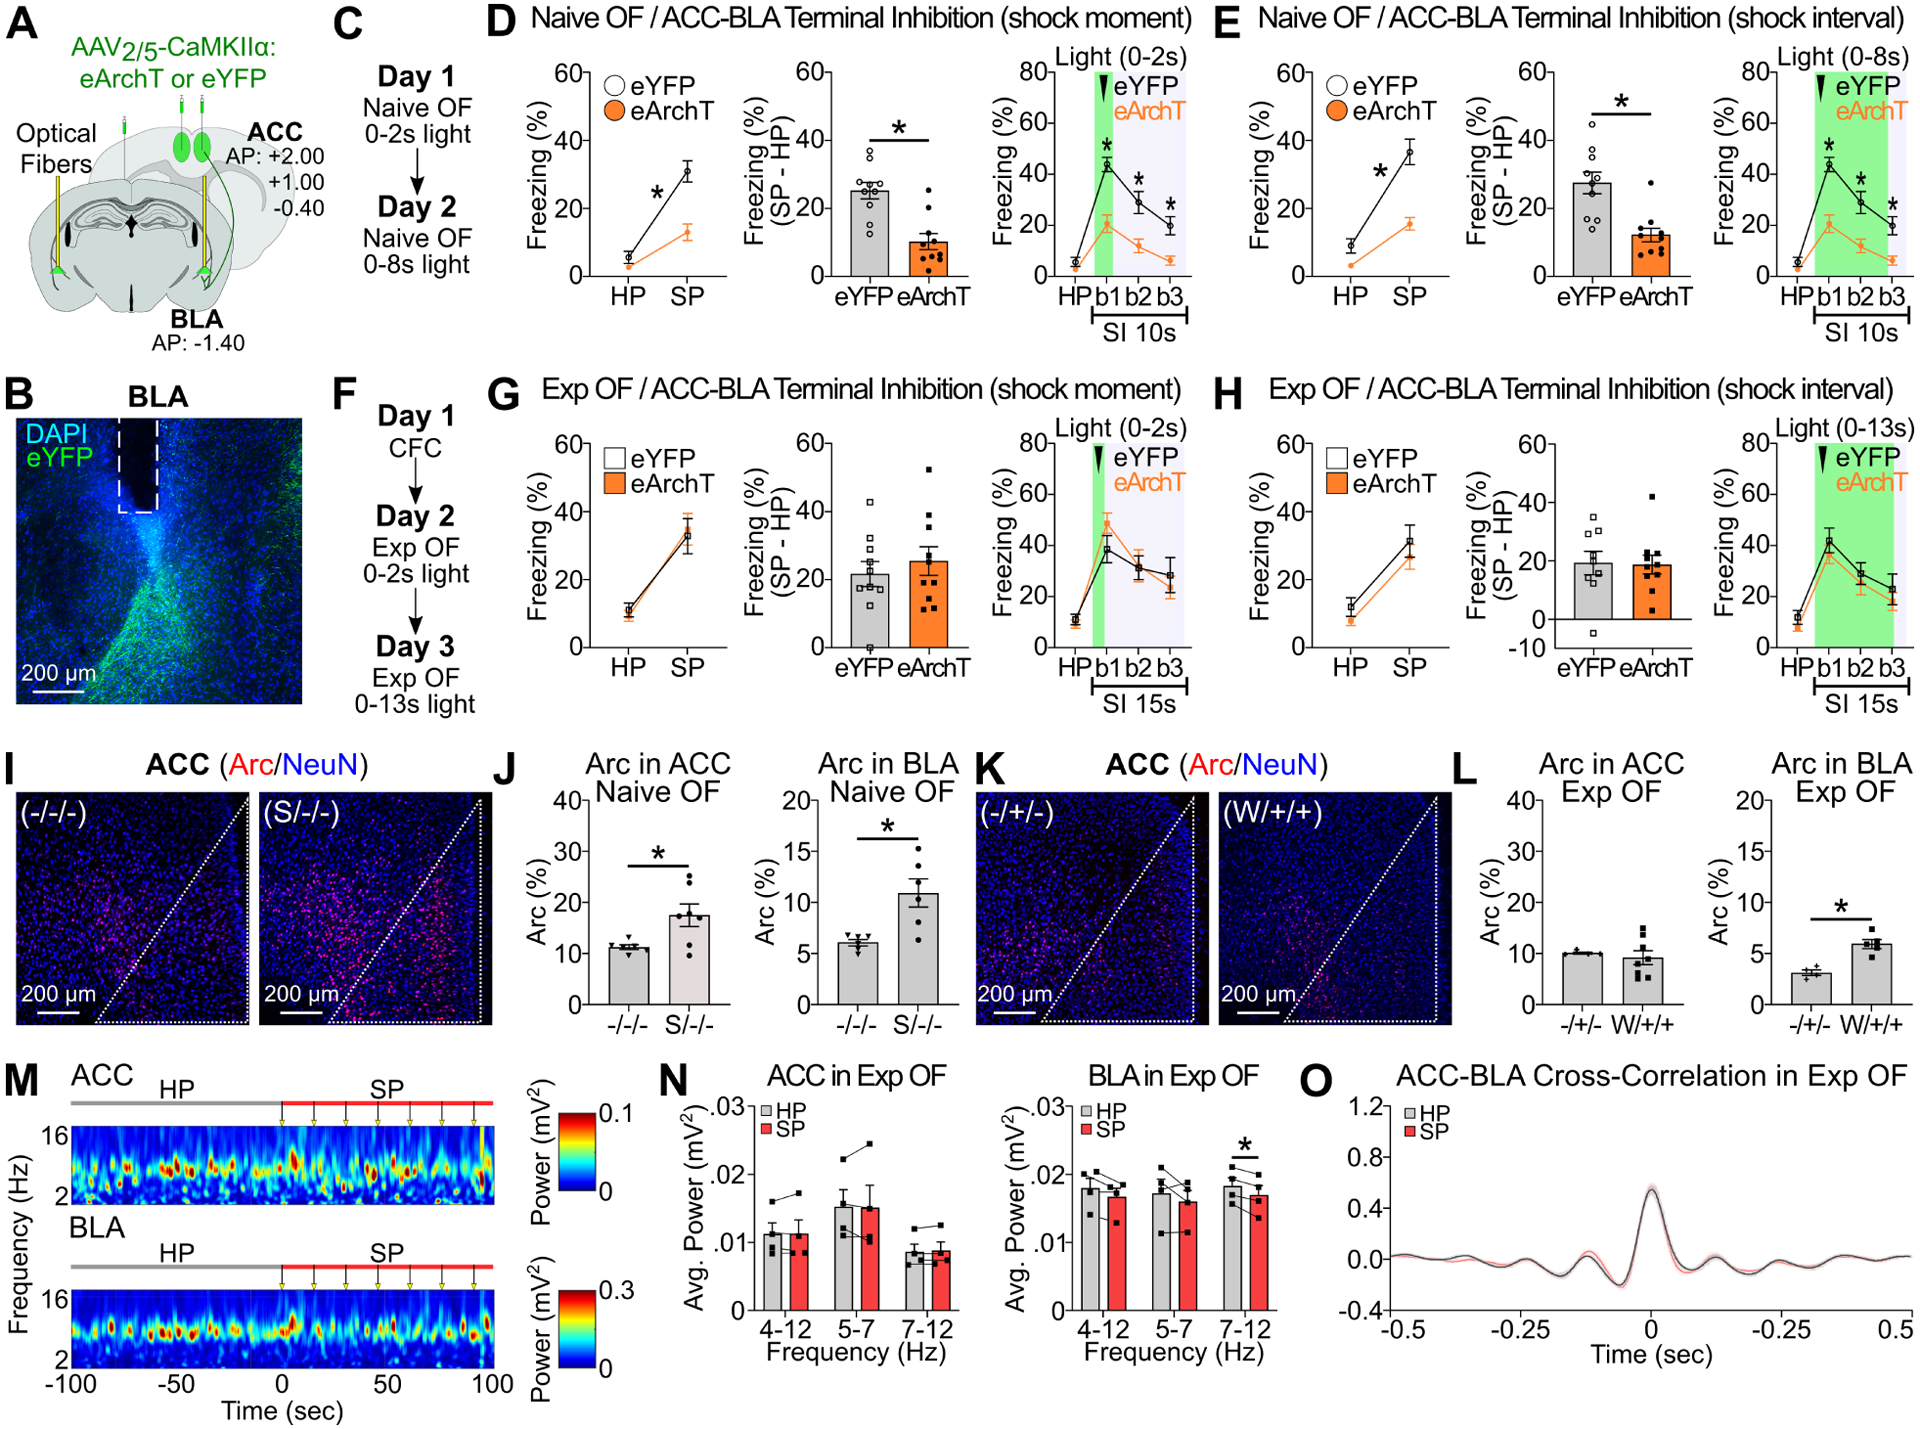
Figure 2: ACC and BLA in Exp OF and Naive OF.

(A) Strategy for optogenetic terminal inhibition of ACC neurons at BLA. (B) Coronal section of BLA with fiber implantation (white lines) in BLA. (C, F) Schedule for Naive OF (C) and Exp OF (F). (D-E, G-H) Observer freezing response with optogenetic inhibition of ACC terminals at BLA in Naive OF (D-E) and Exp OF (G-H) during shock moment (D, G) or shock moment+ post shock period (E, H). (Left) Observer freezing levels during HP and SP of eYFP and eArchT groups. (Middle) Subtraction freezing levels (SP–HP) of eYFP and eArchT groups. (Right) Observer freezing levels in post-shock bins. (I, K) Coronal sections of Arc/NeuN immunohistochemistry in ACC in Naive OF (I) or Exp OF (K). White lines; ACC region. (J, L) Percentages of Arc+ neurons in ACC or BLA in Naive OF (J) or Exp OF (L). (M) Representative spectrograms of local field potentials (LFPs) in ACC and BLA during HP and SP in Exp OF. Arrows; 2-sec 0.5 mA shock delivered to the demonstrator. (N) Averaged theta 4–12 Hz, 5–7 Hz and 7–12 Hz power for ACC (left) and BLA (right) during the HP and SP in Exp OF. (O) Averaged cross-correlation of ACC-BLA neural activity during the HP and SP in Exp OF. N = 4 mice. Graphs show means ± SEM. * P < 0.05 by interaction with two-way mixed ANOVA (D-E, G-H), two-sided unpaired t-test (D-E, G-H, L), Mann-Whitney U-test (D-E, J, L), and two-sided paired t-test (N-O). See also Supplemental Table 1 and Figure S3–4.
