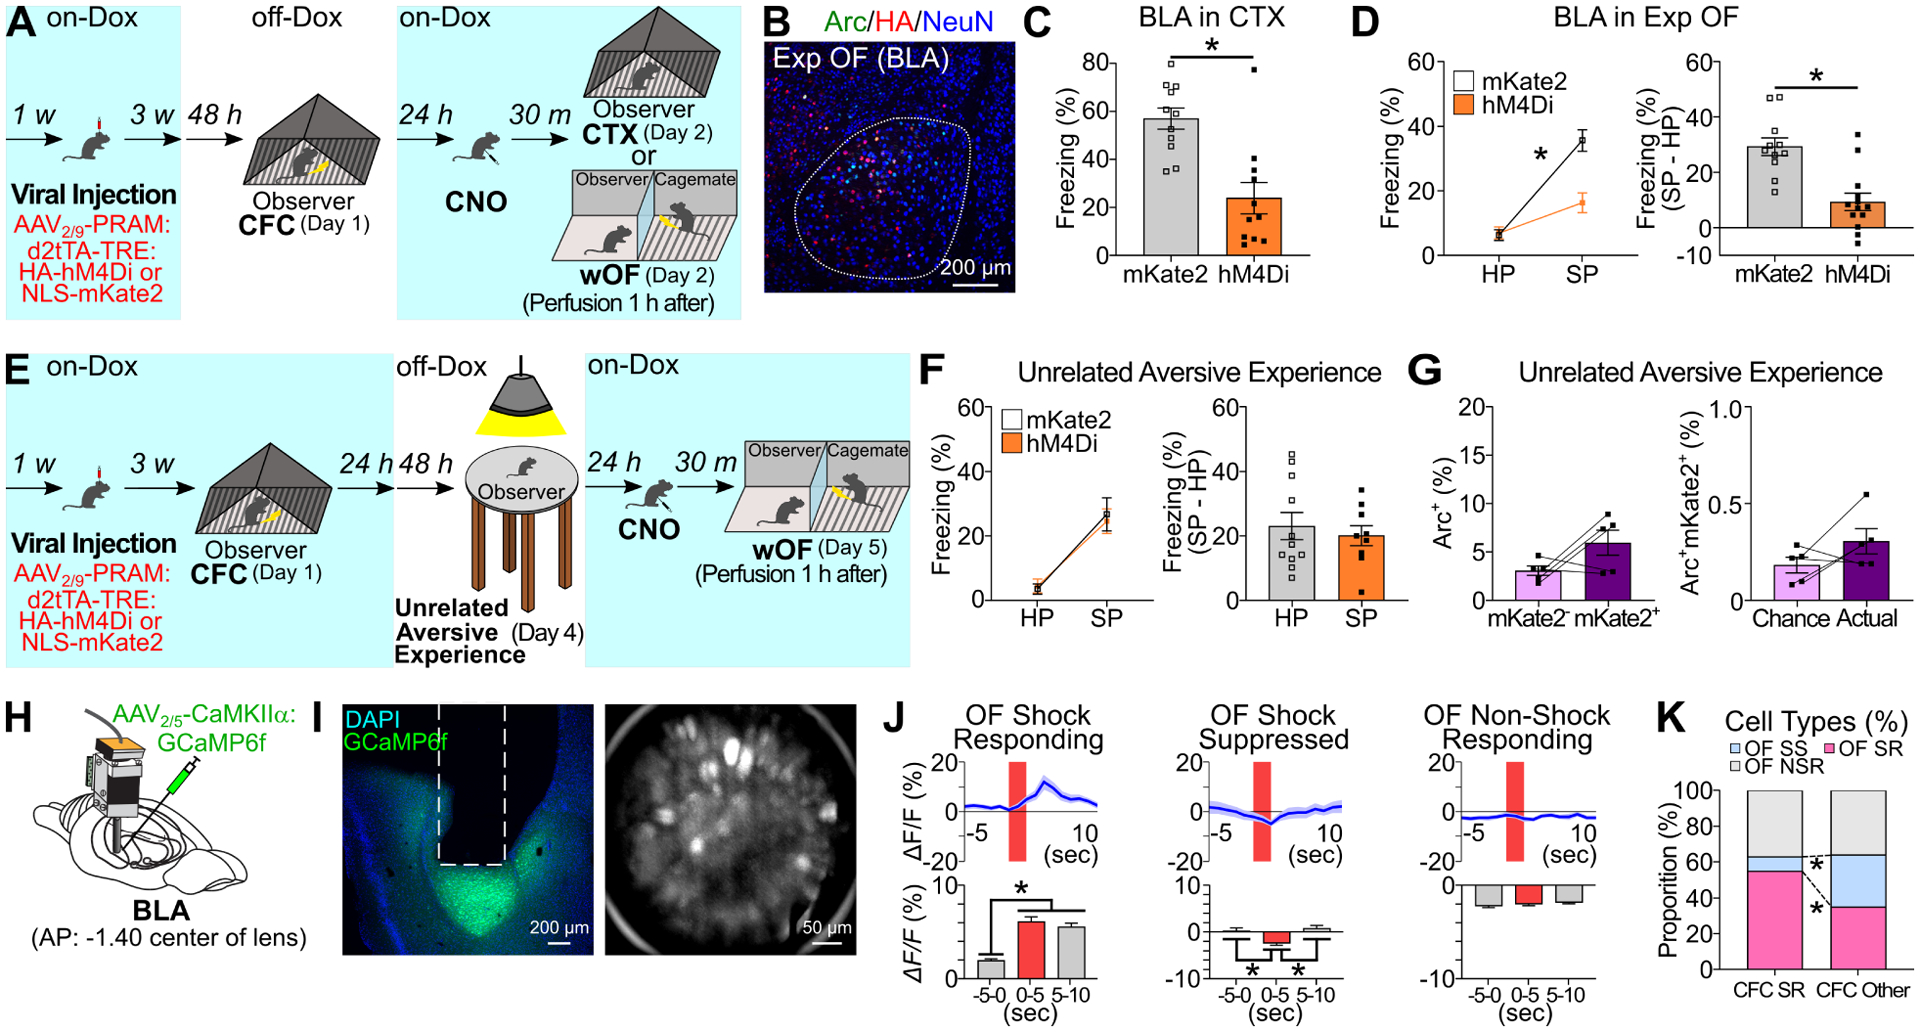
Figure 5. BLA fear memory engram cells in Exp OF.

(A) Inhibition of CFC-activated BLA neurons during CTX (C) or Exp OF (D). (B) Coronal section of BLA in Exp OF. (C) Freezing levels during CTX in mKate2 and hM4Di groups. (D) (Left) Observer freezing levels during HP and SP of mKate2 and hM4Di groups. (Right) Subtraction freezing levels. (E) Experimental schedule for inhibition (F) and reactivation (G) of BLA neurons activated by an unrelated aversive experience (bright light exposure on elevated platform) during Exp OF. (F) (Left) Observer freezing levels during HP and SP of mKate2 and hM4Di groups. (Right) Subtraction freezing levels. (G) (Left) Percentages of Arc+ neurons in mKate2− and mKate2+ neurons in BLA during Exp OF. (Right) Actual percentages and chance levels of Arc+mKate2+ neurons in BLA during Exp OF. (H) BLA GRIN lens implantation. (I) (Left) Coronal section of BLA in GRIN lens (white lines) implantation. (Right) Stacked image acquired through microendoscope. (J) (Top) Averaged calcium activity (ΔF/F %) in OF Shock-Responding (SR), Shock-Suppressed (SS), and Non-Shock Responding (NSR) cell during Exp OF. Shock delivery period (red; 2 sec). (Bottom) Averaged calcium activity in −5–0 sec, 0–5 sec, and 5–10 sec period during Exp OF. (K) Proportion of OF SR, SS, and NSR cells between CFC SR and Other cells. N = 160 cells. Graphs show means ± SEM. * P < 0.05 by two-sided unpaired t-test (C, D, F), interaction with two-way mixed ANOVA (D, F), two-sided paired t-test (G), one-way repeated measures ANOVA with Tukey-Kramer test (J), and chi-square test (K). See also Supplemental Table 1 and Figure S9.
