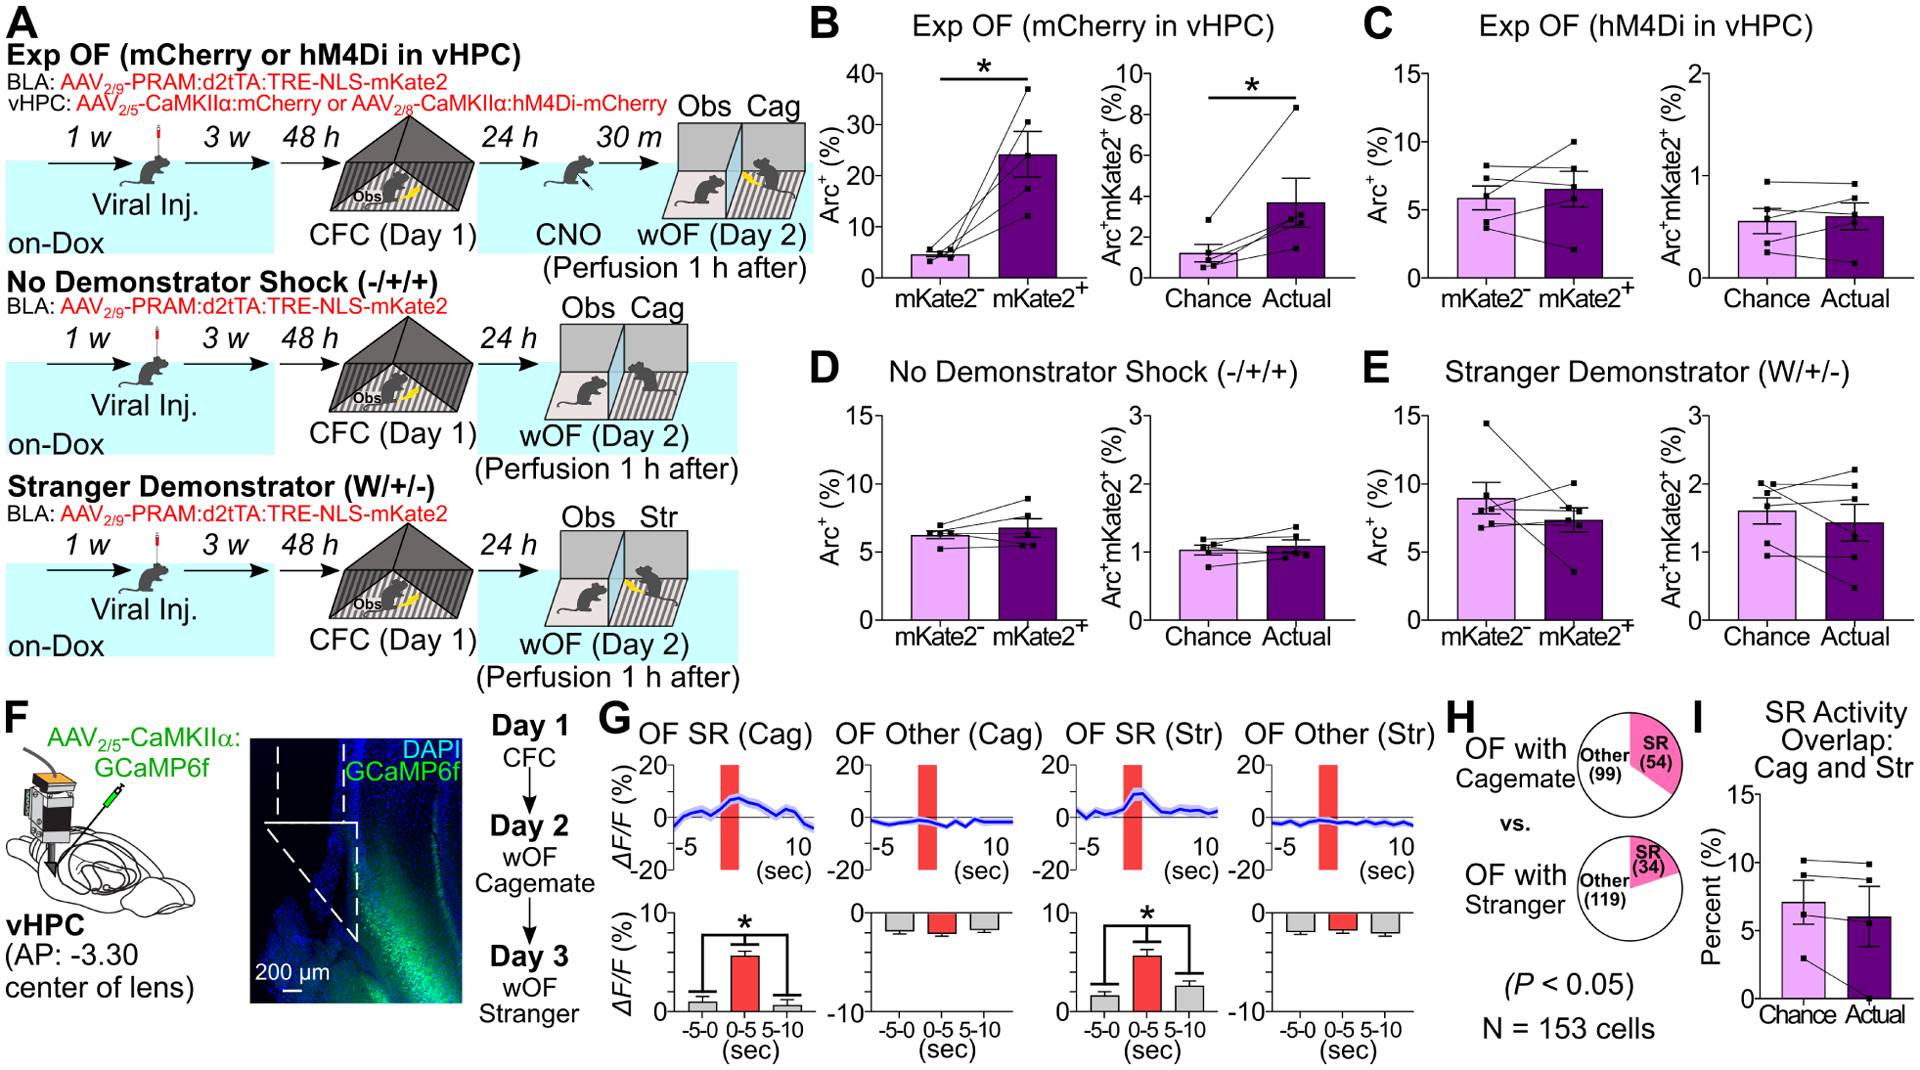
Figure 6. Dynamics and necessity of vHPC neuron activity in Exp OF.

(A) Experimental schedules. (B-E) (Left) Percentages of Arc+ neurons in mKate2− and mKate2+ BLA neurons in Exp OF/mCherry in vHPC, Exp OF/hM4Di in vHPC, No Demonstrator Shock, and Stranger Demonstrator groups. (Right) Actual percentages and chance levels of Arc+mKate2+ BLA neurons in Exp OF/mCherry in vHPC, Exp OF/hM4Di in vHPC, No Demonstrator Shock, and Stranger Demonstrator groups. (F) (Left) vHPC GRIN lens implantation. (Center) Coronal section of vHPC in GRIN lens (white lines) implantation. (Right) Schedule (imaging on Day 2 and Day 3). (G) (Top) Averaged calcium activity (ΔF/F %) of Cagemate and Stranger OF SR and OF Other cells during Exp OF. (Bottom) Averaged calcium activity in −5–0 sec, 0–5 sec, and 5–10 sec period during Exp OF. (H) Proportion of vHPC OF-SR and OF-Other cells between cagemate and stranger demonstrator. (I) Actual percentages and chance levels of Cagemate SR/Stranger SR cells during OF. Graphs show means ± SEM. * P < 0.05 by two-sided paired t-test (B-E, I), one-way repeated measures ANOVA with Tukey-Kramer test (G), and chi-square test (H). See also Supplemental Table 1 and Figure S10–11.
