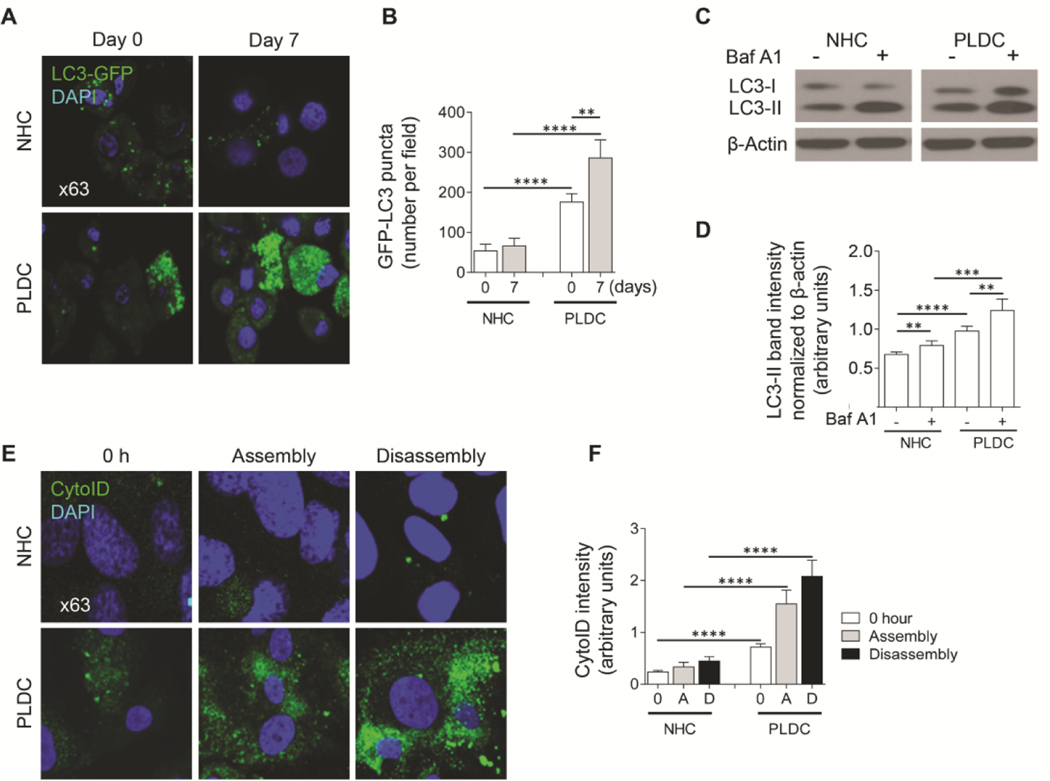
FIG. 3.
Autophagy is enhanced in PLDC with impaired ciliogenesis. (A) Representative IF images and (B) a quantitative analysis show a greater GFP-LC3 puncta in PLDC compared to NHC at day 0, and an increase at day 7. (C) Western blot of LC3 and (D) a quantitative analysis show increased autophagic flux in PLDC vs NHC [i.e., the levels of LC3-II normalized to β-actin is greater and increased in the presence of autophagy inhibitor, Bafilomycin A1 (Baf A1)]. (E) IF images and (F) a quantitative analysis show increased fluorescence of CYTO-ID (green) that selectively labels autophagosomes. In PLDC, CYTO-ID fluorescence increased during both cilia assembly and disassembly. Nuclei (blue, DAPI). Data are presented as Mean±SD. n=3 for each condition; **p<0.05; ***p<0.001; ****p<0.0001.

