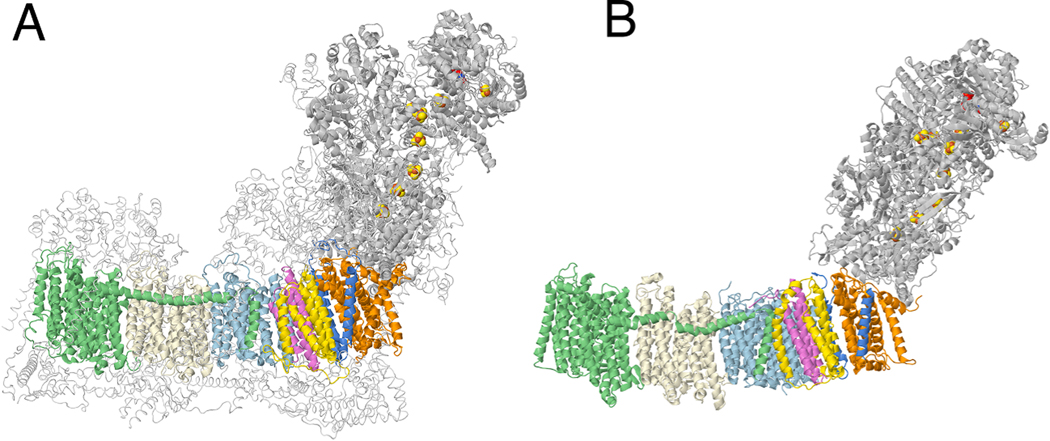
Fig. 1.
A comparison of the structures of Complex I from ovine and from E. coli. (A) The core membrane subunits are colored: ND1 (orange), ND3 (blue), ND6 (yellow), ND4L (violet), ND2 (light blue), ND4 (light yellow), ND5 (green). Other core subunits from the peripheral arm are shown in gray ribbons. FMN and FeS clusters are in space filling mode. Supernumerary subunits are shown in backbone trace colored light gray. The PDB file is 5lnk, a high-resolution mammalian structure (Fiedorczuk et al., 2016). (B) The same coloring scheme is used for the E. coli enzyme (PDB file 7nyr (Kolata and Efremov, 2021)). nuoH (orange), nuoA (blue), nuoJ (yellow), nuoK (violet), nuoN (light blue), nuoM (light yellow), nuoL (green). (For interpretation of the references to color in this figure legend, the reader is referred to the web version of this article.)

