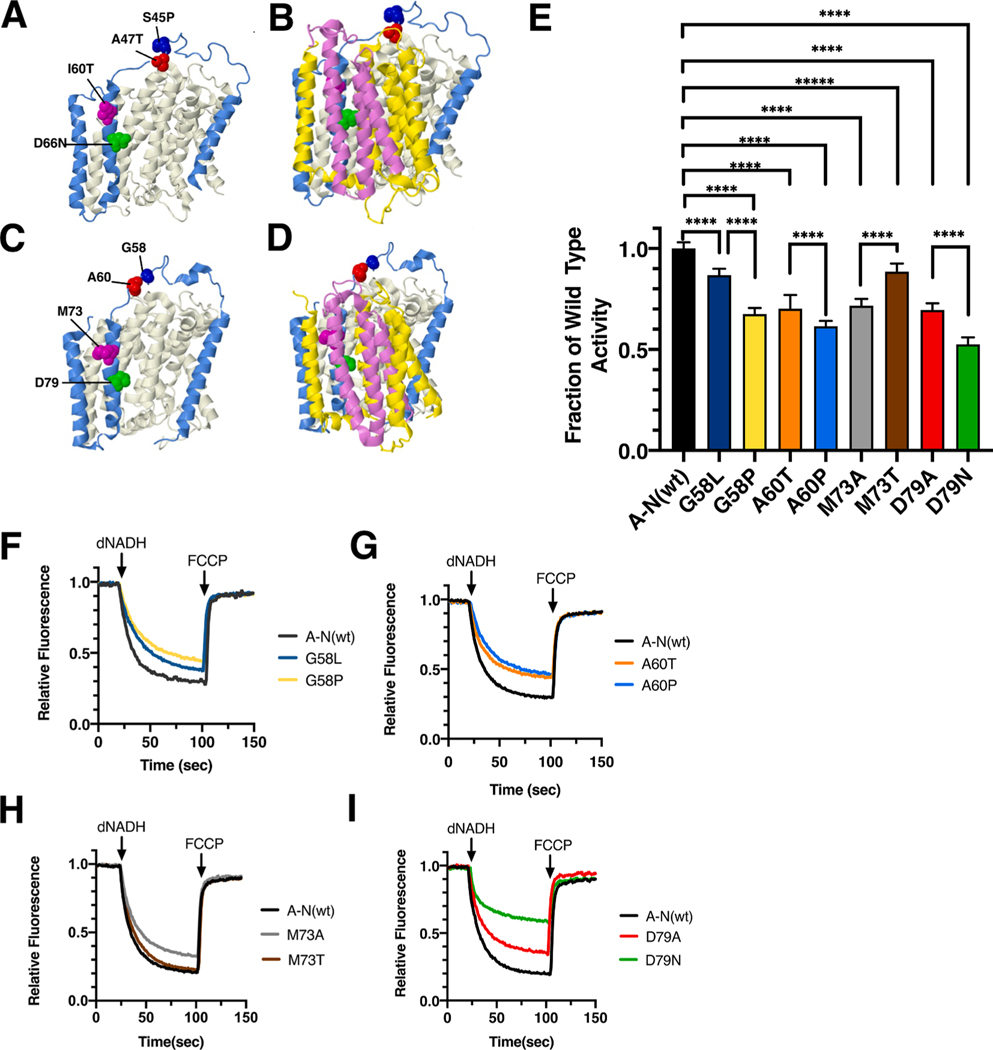
Fig. 10.
Analysis of ND3 mutations in nuoA of E. coli. (A) The locations of human mutations S45P (red), A47T (blue), I60T (magenta), and D66N (green) are shown in ND3 (blue). ND1 is shown in beige, using PDB file 5xtd (Gu et al., 2016). (B) Neighboring subunits ND4L (violet) and ND6 (yellow) are shown. (C) The locations of E. coli residues G58 (red), A60 (blue), M73 (magenta), and D79 (green) are shown in nuoA (blue) as modeled in the T. thermophilus structure (PDB file 4hea (Baradaran et al., 2013)). nuoH is shown in beige. (D) Neighboring subunits nuoK (violet) and nuoJ (yellow) are shown. (E) dNADH-oxidase activities of membrane vesicles prepared from the E. coli mutants are shown compared to a wild type sample prepared the same day. (F, G, H, I) Proton translocation rates from the same samples shown in panel E are indicated by fluorescence quenching of the acridine dye ACMA. (For interpretation of the references to color in this figure legend, the reader is referred to the web version of this article.)

