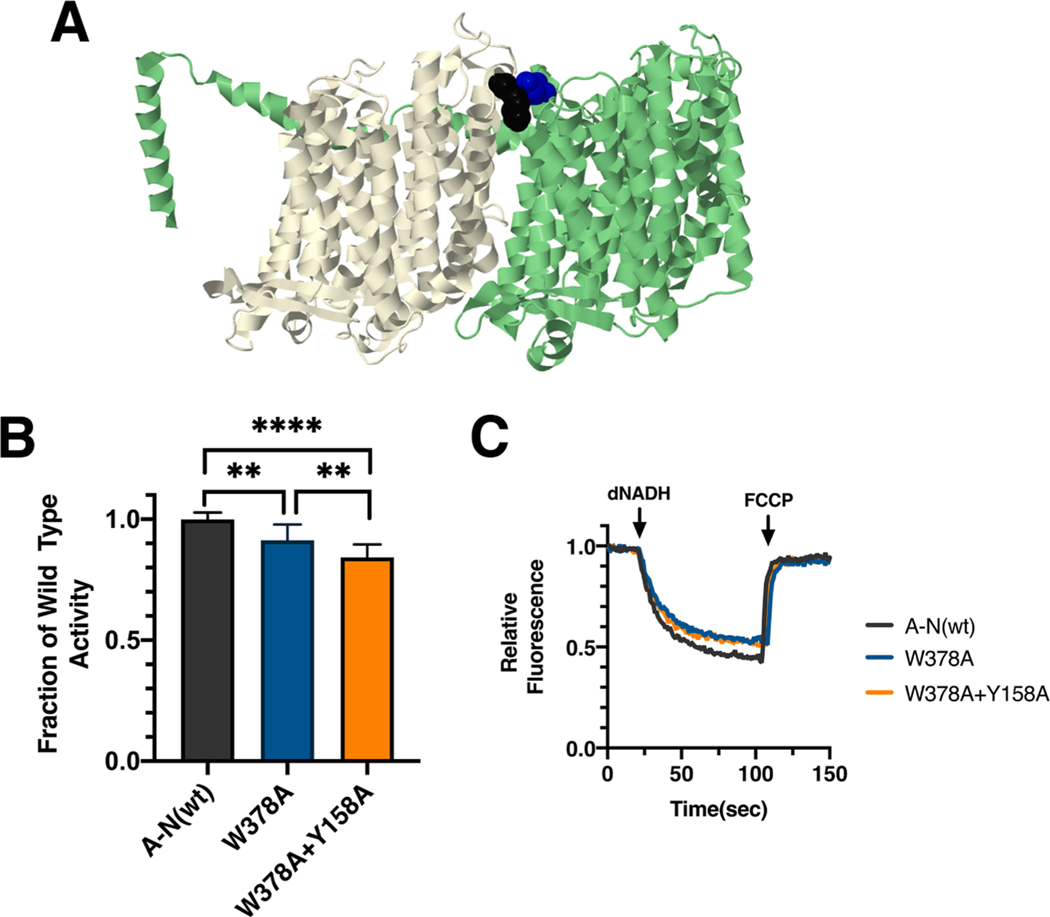
Fig. 3.
Analysis of interacting mutations in nuoL of E. coli. (A) The locations of mutations M_W378 (black) and Y158A (blue) are shown in nuoL (green) and nuoM (light yellow), using PDB file 3rko (Efremov and Sazanov, 2011). (B) dNADH-oxidase activities of membrane vesicles prepared from the E. coli mutants nuoM_W378A and double mutant nuoM_W378A/nuoL_Y158A are shown compared to a wild type sample prepared the same day. (C) Proton translocation rates from the same samples shown in panel B are indicated by fluorescence quenching of the acridine dye ACMA. **P < 0.01; ****P < 0.0001. (For interpretation of the references to color in this figure legend, the reader is referred to the web version of this article.)

