Fig. 7.
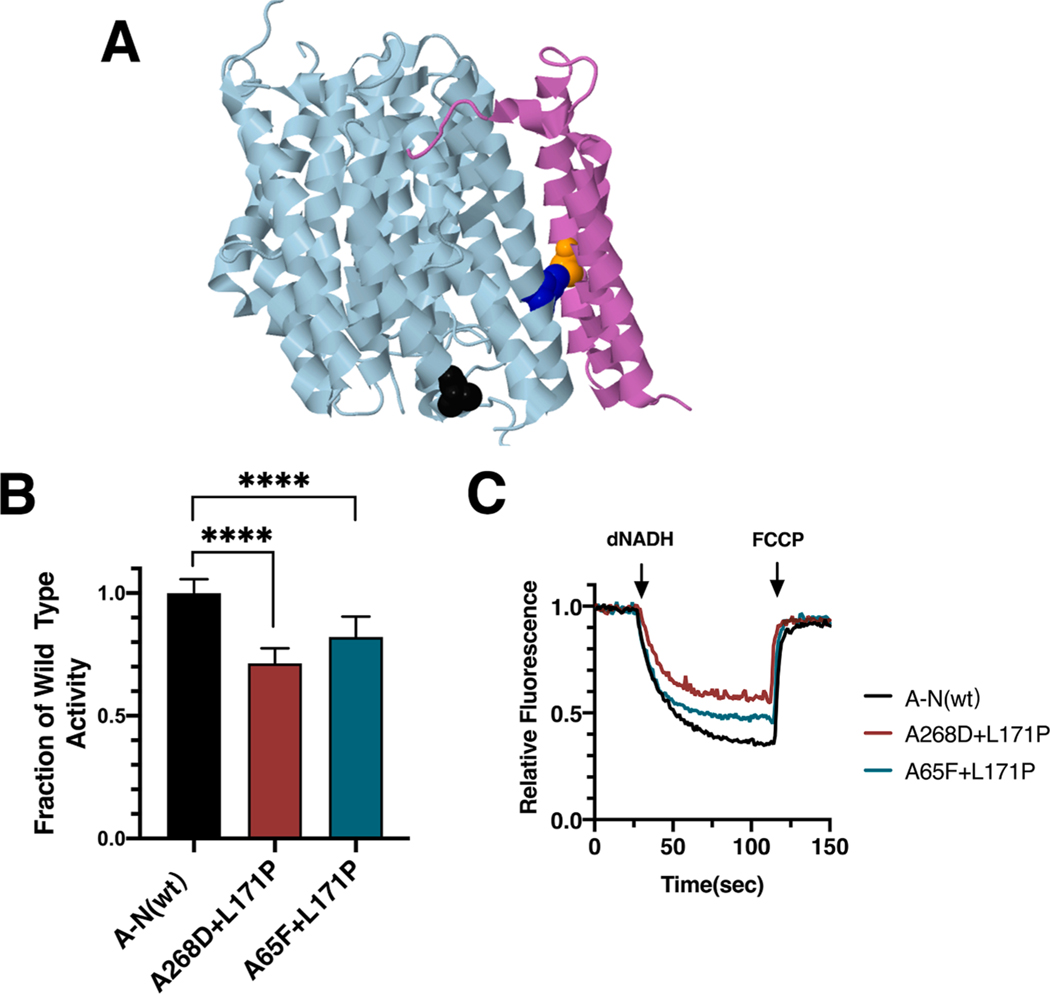
Analysis of interacting mutations in nuoN of E. coli. (A) The locations of mutations K_A65F (orange), N_A268D (black), and N_L171P (blue) are shown in nuoN (light blue) and nuoK (violet), using PDB file 3rko (Efremov and Sazanov, 2011). (B) dNADH-oxidase activities of membrane vesicles prepared from the E. coli double mutants nuoN_A268D/nuoN_L171P and nuoK_A65F/nuoN_L171P are shown compared to a wild type sample prepared the same day. (C) Proton translocation rates from the same samples shown in panel B are indicated by fluorescence quenching of the acridine dye ACMA. (For interpretation of the references to color in this figure legend, the reader is referred to the web version of this article.)

