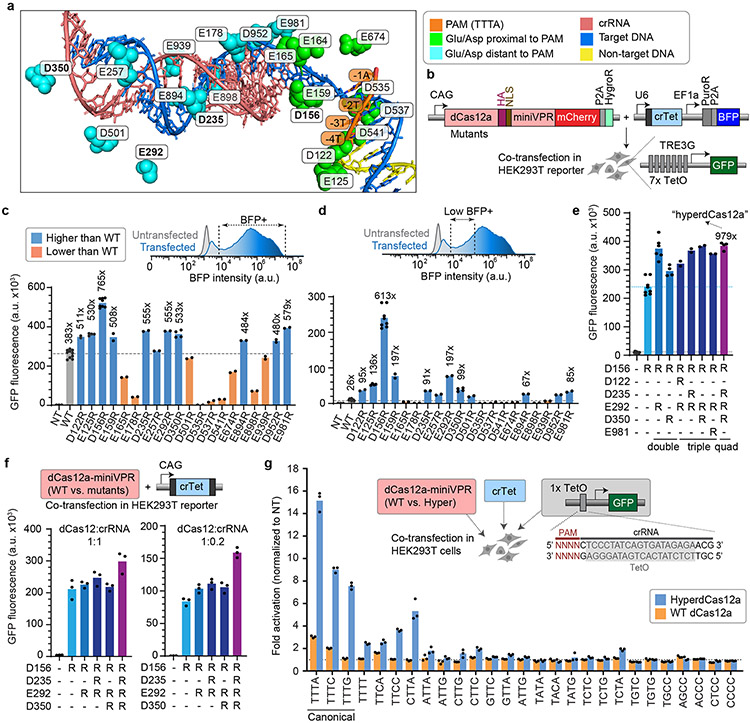
Figure 1 ∣. Development of combinatorial dCas12a mutants with superior activity at low crRNA conditions.
a, Structure of LbCas12a (PDB 5XUS) highlighting Glu and Asp residues within 10Å of the target DNA. Green, residues proximal to PAM. Blue, residues distant to PAM. b, Constructs used for co-transfection to test CRISPR activation using a Tet crRNA (crTet) driven by U6 promoter, with dCas12a mutants in HEK293T cells stably expressing GFP driven by the inducible TRE3G promoter, and collected for flow cytometry 2 days after transfection. c, GFP fluorescence in reporter cells for WT dCas12a vs. mutants. Fold changes were calculated relative to non-targeting crLacZ. For ease of visualization, dotted line in is drawn at the level of WT. d, Representative flow cytometry histogram of BFP intensity, comparing untransfected vs. transfected cells, showing subset of “low BFP” cells. Fold changes of GFP fluorescence in this “low BFP” population were calculated relative to non-targeting crLacZ. Dotted line is drawn at the level of WT. e, GFP fluorescence in the “low BFP” cells, comparing WT dCas12, single mutants, and combinatorial variants with several most potent single mutations from c. The quadruple mutant (D156R + D235R + E292R + E350R) is heretofore referred to as “hyper-efficient dCas12” (hyperdCas12a). Fold changes were calculated relative to non-targeting crLacZ. Dotted line is drawn at the level of the single D156R mutant. In c-e, each data point represents the mean GFP intensity of an independent experiment, with each bar representing the average of 2 or more independent experiments. f, GFP fluorescence for WT dCas12a vs. dCas12 mutants, both at crRNA:dCas12a ratio = 1:1 (left panel), or 0.2:1 (right panel). g. In parental HEK293T cells, hyperdCas12a vs. WT dCas12a and crTet were co-transfected with a third plasmid containing a truncated TRE3G promoter that contains a single TetO element preceded by 27 various PAMs. Cells were gated for mCherry+ and low BFP+. Fold changes were calculated relative to non-targeting crLacZ. For ease of visualization, dotted line is drawn at the level of the non-targeting crRNA. In f-g, each data point represents the mean GFP intensity of an independent experiment, with each bar showing the average of 3 independent experiments.

