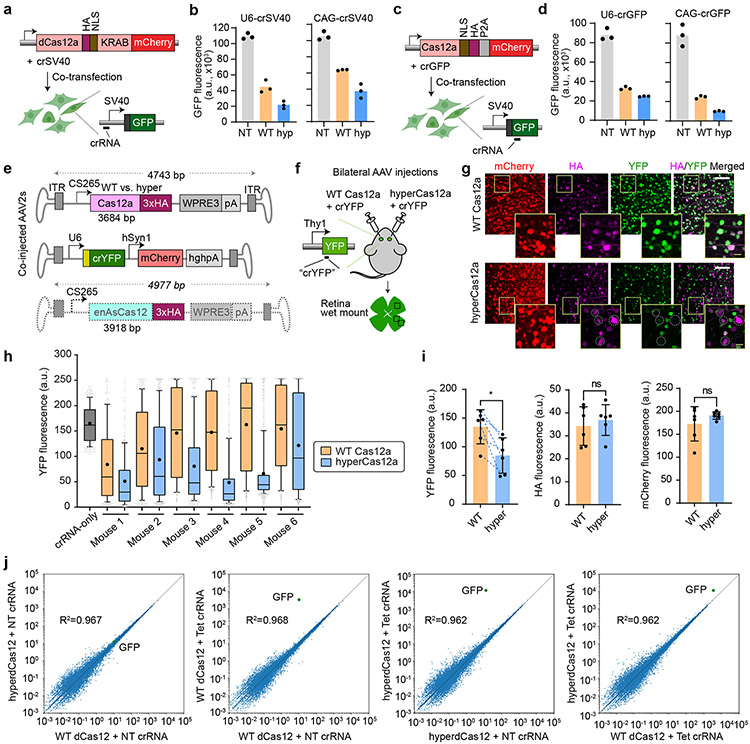
Figure 2 ∣. HyperCas12a outperforms wildtype dCas12 in CRISPR repression and in vivo gene editing.
a, Constructs to test CRISPR repression. WT dCas12a or hyperdCas12a fused to the transcriptional repressor KRAB is co-transfected with crRNA (driven by U6 promoter or CAG promoter) targeting SV40 promoter in HEK293T cells stably expressing SV40-GFP, and analyzed at 5 days after transfection. b, GFP fluorescence in assay described in panel a. c, Constructs to test gene editing. Nuclease-active WT Cas12a or hyperCas12a is co-transfected with crGFP (targeting a coding region of GFP) in HEK293T cells stably expressing SV40-GFP, and analyzed at 5 days after transfection. d, GFP fluorescence in the gene editing assay described in panel c. In b and d, each data point represents the mean GFP intensity of an experiment, with each bar showing the average of 3 independent experiments. NT, non-targeting crRNA; WT, wildtype dCas12a, hyp, hyperdCas12a. e. AAV constructs for in vivo gene editing. f. Schematic of intravitreal injections, where AAV-hyperCas12a + AAV-crYFP is delivered into one eye while AAV-WT Cas12a + AAV-crYFP is delivered to the fellow eye. g. Immunohistochemistry of retinal wet mounts. Dotted circles highlight mCherry+/HA+ cells missing YFP expression. White scale bars, 100 μm. Yellow scale bars (within insets), 20 μm. h. YFP fluorescence in mCherry+ cells quantitated in each mouse by automated segmentation analyses. Data for all 6 mice are displayed, which are 6 independent biological replicates. For each mouse, n = 250-800 cells were analyzed with the exact n number shown in Source data for Fig. 2. For box-and-whisker plots, the box shows 25-75% (with bar at median, dot at mean), and whiskers encompass 10-90%, with individual data points shown for the lowest and highest 10% of each dataset. i. The mean YFP fluorescence (left), HA signal (middle) and mCherry fluorescence (right) for each mouse as measured by automated segmentation analysis. Mean± s.d. and individual data points shown for n=6 independent animals. P-values were calculated using a paired two-tailed Student’s t-test; **p=0.0078; ns, non-significant. For YFP graph, blue dotted lines are drawn to connect values for each mouse to facilitate comparison of this paired dataset. j, Plasmids with dCas12a-miniVPR (WT or hyper) and crRNA were co-transfected into HEK293T cells stably expressing TRE3G-GFP (per Fig. 1b), and collected for genome-scale RNA-sequencing (RNA-seq) 2 days after transfection. GFP gene is labeled in green. The plots represent representative results from two independent RNA-seq experiments (for reproducibility plots, refer to Extended Data Fig. 4b).

