
Figure 1. P-TEFb interacts with activated PARP1 upon DNA damage.
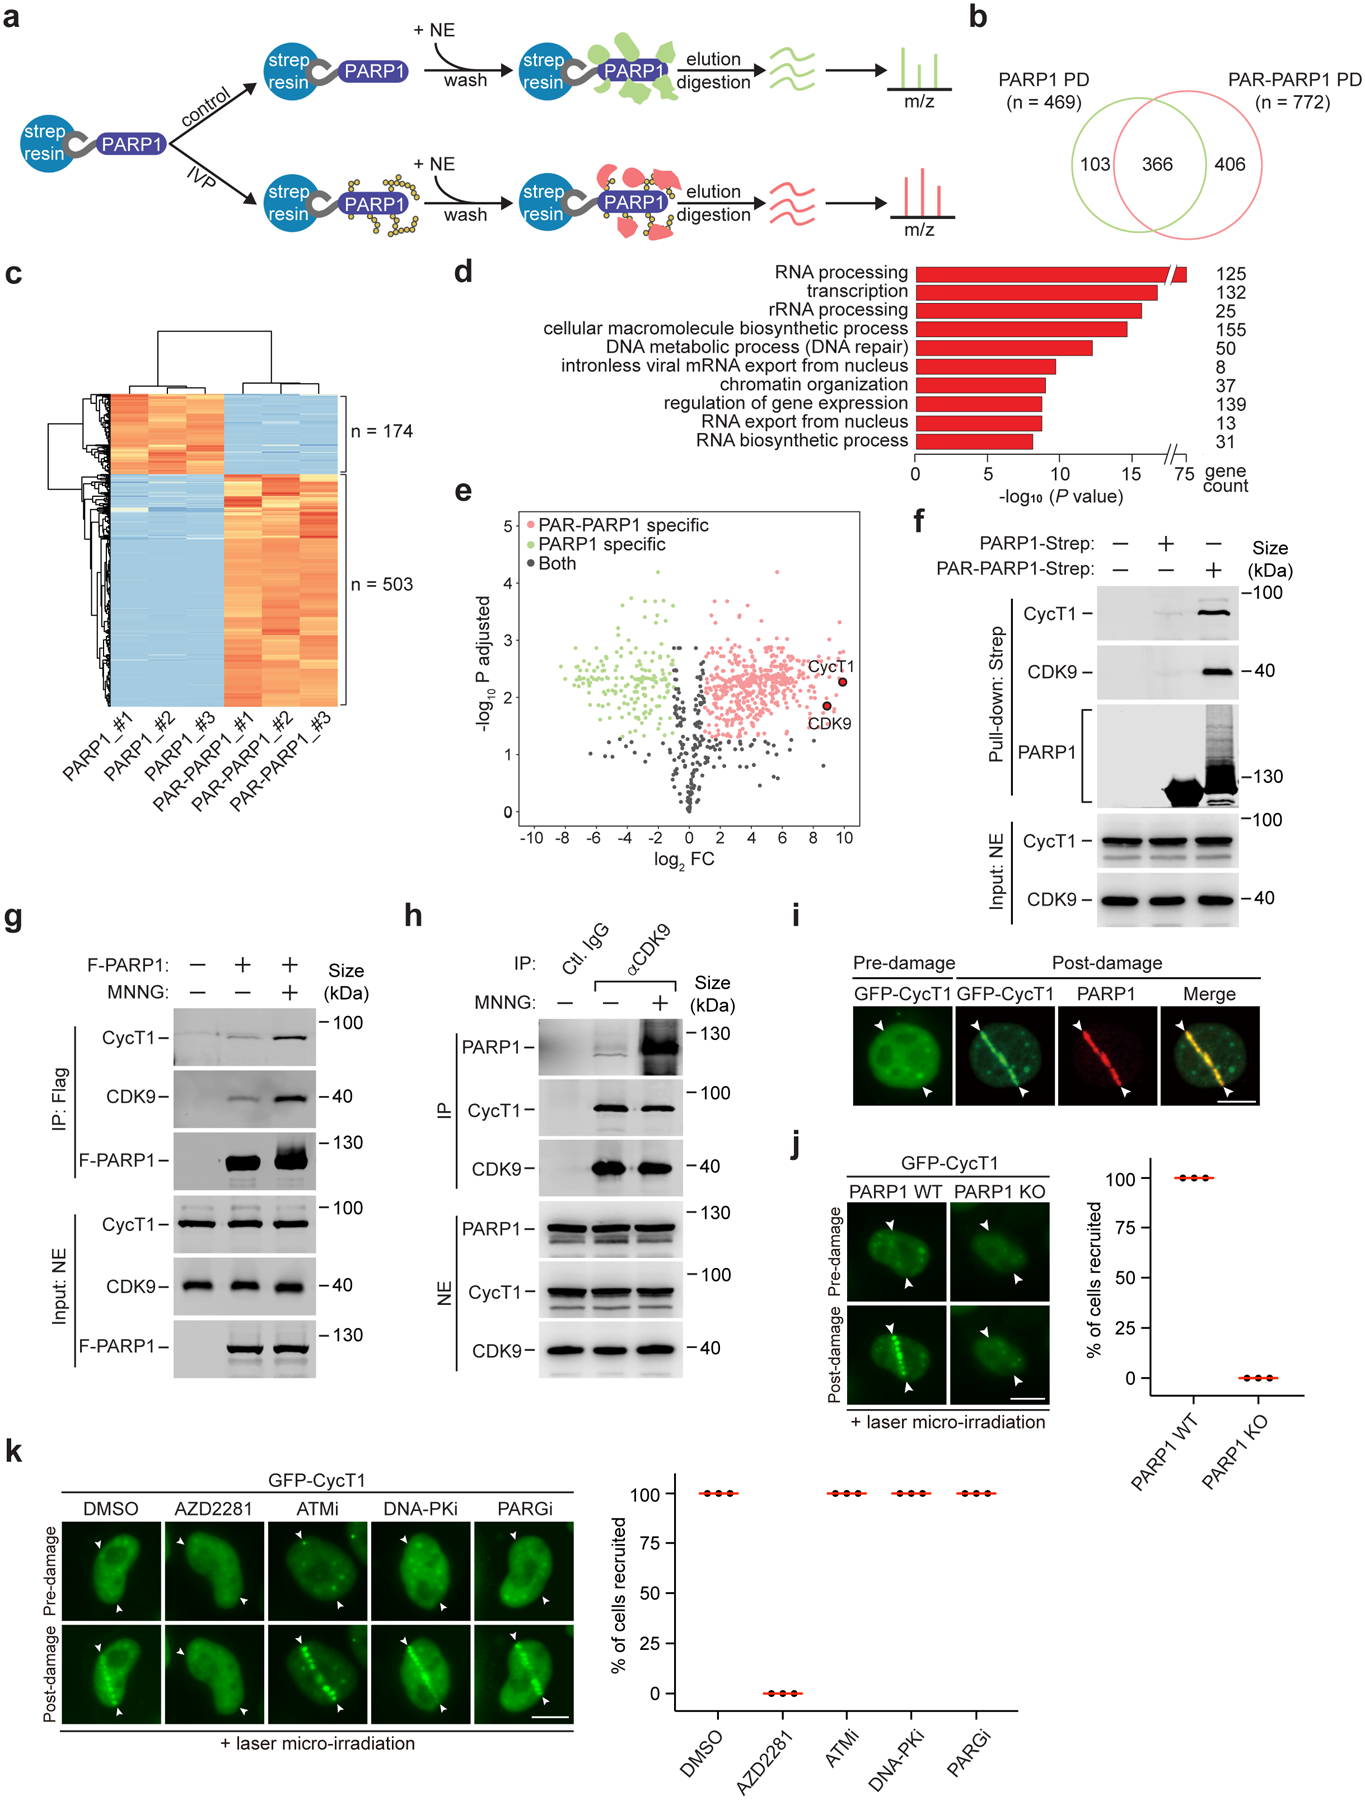
a, Experimental design of comparative mass spectrometry analysis of the PARP1 and PAR-PARP1 interactomes obtained by pull downs. IVP: In vitro PARylation. NE: Nuclear extracts. m/z: Mass-to-charge ratio. b, Venn diagram depicting the number of proteins identified by mass spectrometry from the PARP1 or PAR-PARP1 pull-down (PD). c, Heat map analysis depicting label-free quantifications of the number of proteins bound to PARP1 or PAR-PARP1 with at least 2-fold changes. The binding assays were performed in triplicates as indicated by #1–3. d, Gene ontology analysis of the MS-identified proteins that specifically interacted with PAR-PARP1. Statistical analysis was performed using the Benjamini-Hochberg procedure. e, Volcano plot analysis to visualize the identified proteins after label-free quantification. The x-axis is the log2 fold change of protein abundance in the PAR-PARP1 PD over the PARP1 PD. Red, green, and black dots indicate the proteins bound to PAR-PARP1, PARP1 and both, respectively. Dots for CDK9 and CycT1 are highlighted. f, Immobilized PARP1-Strep or PAR-PARP1-Strep was incubated with NE. The input and pull-down proteins were analyzed by Western blotting (WB). g, HeLa cells expressing F-PARP1 or not (−) were either untreated or treated with MNNG. NE and anti-Flag immunoprecipitates (IP) were analyzed by WB. h, HeLa cells were untreated or treated with MNNG. NE and IP with the indicated antibodies were analyzed by WB. i, HeLa cells expressing GFP-CycT1 were subjected to laser microirradiation and analyzed by immunofluorescence staining with antibody against PARP1. The entry and exit points of the laser beam are indicated by arrowheads. j, WT or PARP1 KO HeLa cells expressing GFP-CycT1 were subjected to laser irradiation and then imaged by live-cell microscopy. Right: Quantification of % cells showing the GFP-CycT1 recruitment. k, HeLa cells expressing GFP-CycT1 were treated with the indicated inhibitors and analyzed as in j. Experiment in i was repeated twice, yielding similar results. i-k, Scale bar = 10 μM. j, k, data are presented as mean ± s.d. with n = 3 independent experiments. All Western blots are representative of three independent experiments. Gel source data are available online.