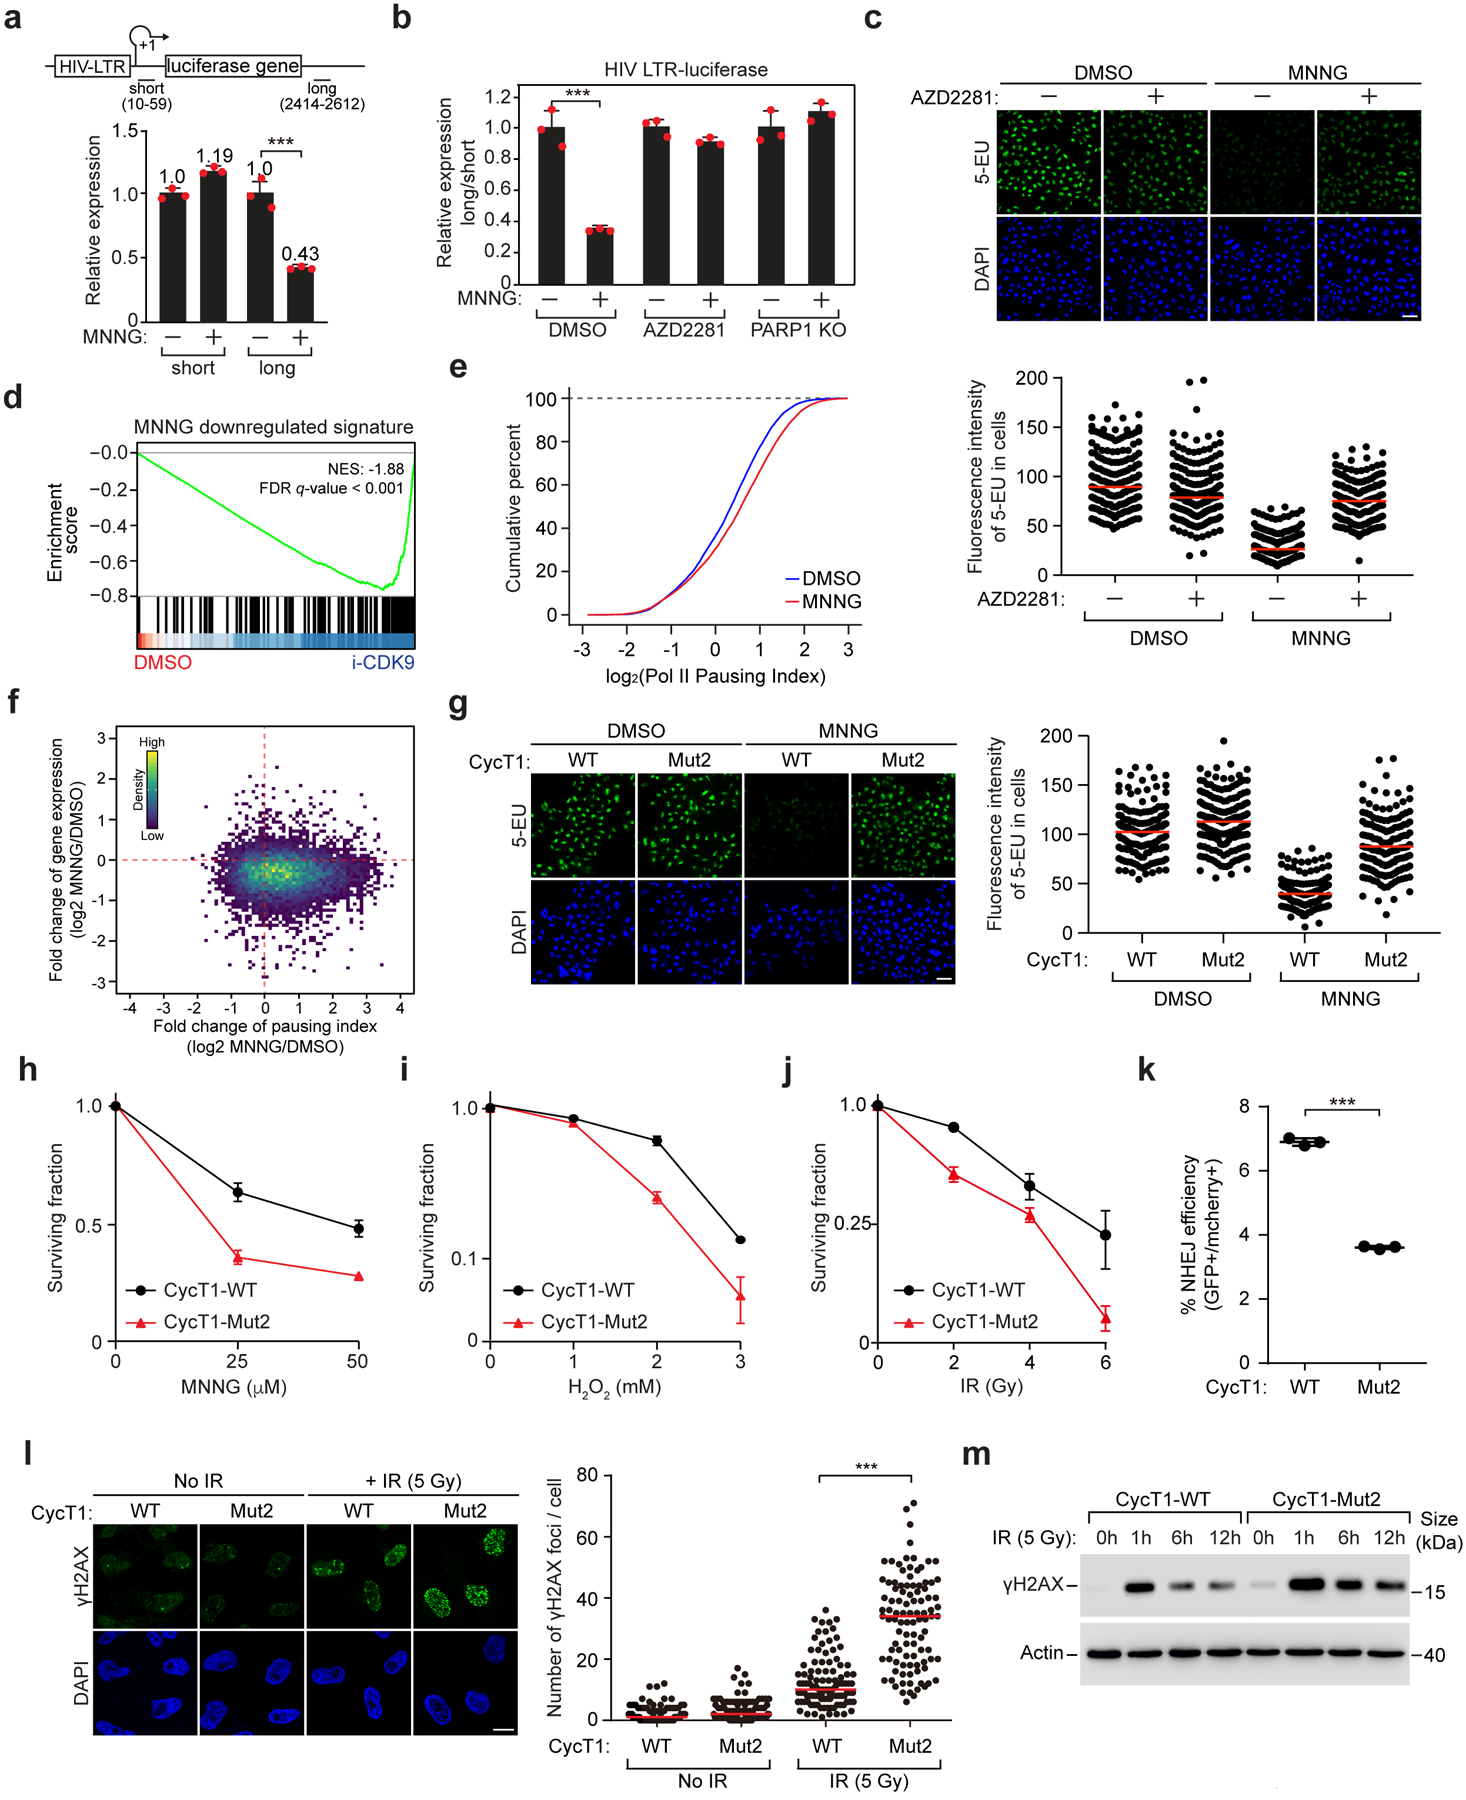
Figure 6. PARylation of CycT1 downregulates transcriptional elongation and promotes DNA repair and cell survival upon DNA damage.

a, The normalized mRNA levels at the promoter-proximal (short) and –distal (long) positions of HIV-1 LTR-luciferase reporter gene in untreated or MNNG-treated cells were determined by 4sU-labeling followed by qRT-PCR analysis. b, WT or PARP1 KO cells containing HIV-1 LTR-luciferase reporter were treated with the indicated chemicals. The “long vs. short” ratios of HIV-1 mRNA levels were measured as in a. c, HeLa cells were untreated or pre-treated with AZD2281 and then treated with DMSO or MNNG. Newly synthesized RNA was analyzed by 5-EU-labeling. Bottom: Quantification of fluorescence intensity per cell. Red lines indicate mean intensity in each group. The number of cells analyzed: control-DMSO: 188; AZD2281-DMSO: 221; control-MNNG: 195; AZD2281-MNNG: 202. d, GSEA showing RNA-seq-detected MNNG-downregulated gene set in i-CDK9- versus DMSO-treated cells. e, CUT & RUN-sequencing analysis of Pol II pausing index in cells treated with DMSO or MNNG. f, Scatterplot showing the log2 fold changes of gene expression versus Pol II pausing index after exposure to MNNG. g, Newly synthesized RNA in HeLa cells reconstituted with the indicated CycT1 proteins were untreated or treated with MNNG and analyzed as in c. The number of cells examined: CycT1-WT-DMSO: 165; CycT1-Mut2-DMSO: 174: CycT1-WT-MNNG: 162; CycT1-Mut2-MNNG: 156. h-j, Viability of cells reconstituted with the indicated CycT1 was measured before or after the exposure to MNNG (h), H2O2 (i) and IR (j). k, NHEJ efficiency of U2OS EJ5-GFP cells expressing the indicated CycT1 was analyzed by FACS for GFP levels 48 hr after I-SceI expression. l, HeLa cells reconstituted with WT or Mut2 CycT1 were analyzed by immunofluorescence staining before and 12 hr after IR treatment with anti-γH2AX. Scale bar = 10 μM. Right: Quantification of the γH2AX foci number per cell. Red lines indicate the mean in each population. The number of cells examined: CycT1-WT no IR: 101; CycT1-Mut2 no IR: 106; CycT1-WT+IR: 103; CycT1-Mut2+IR: 100. m, HeLa cells reconstituted with WT or Mut2 CycT1 were untreated or treated with IR and allowed to recover for the indicated periods. WCE was examined by WB. In a, b, h-k, data are presented as mean ± s.d. with n = 3 independent samples. In c, g, scale bar = 50 μM. In c, g, i, m, data are representative of three independent experiments with similar results. Gel source data are available online.
