
Extended Data Fig. 1. Kinetics of CycT1 recruitment to laser-induced DNA lesions.
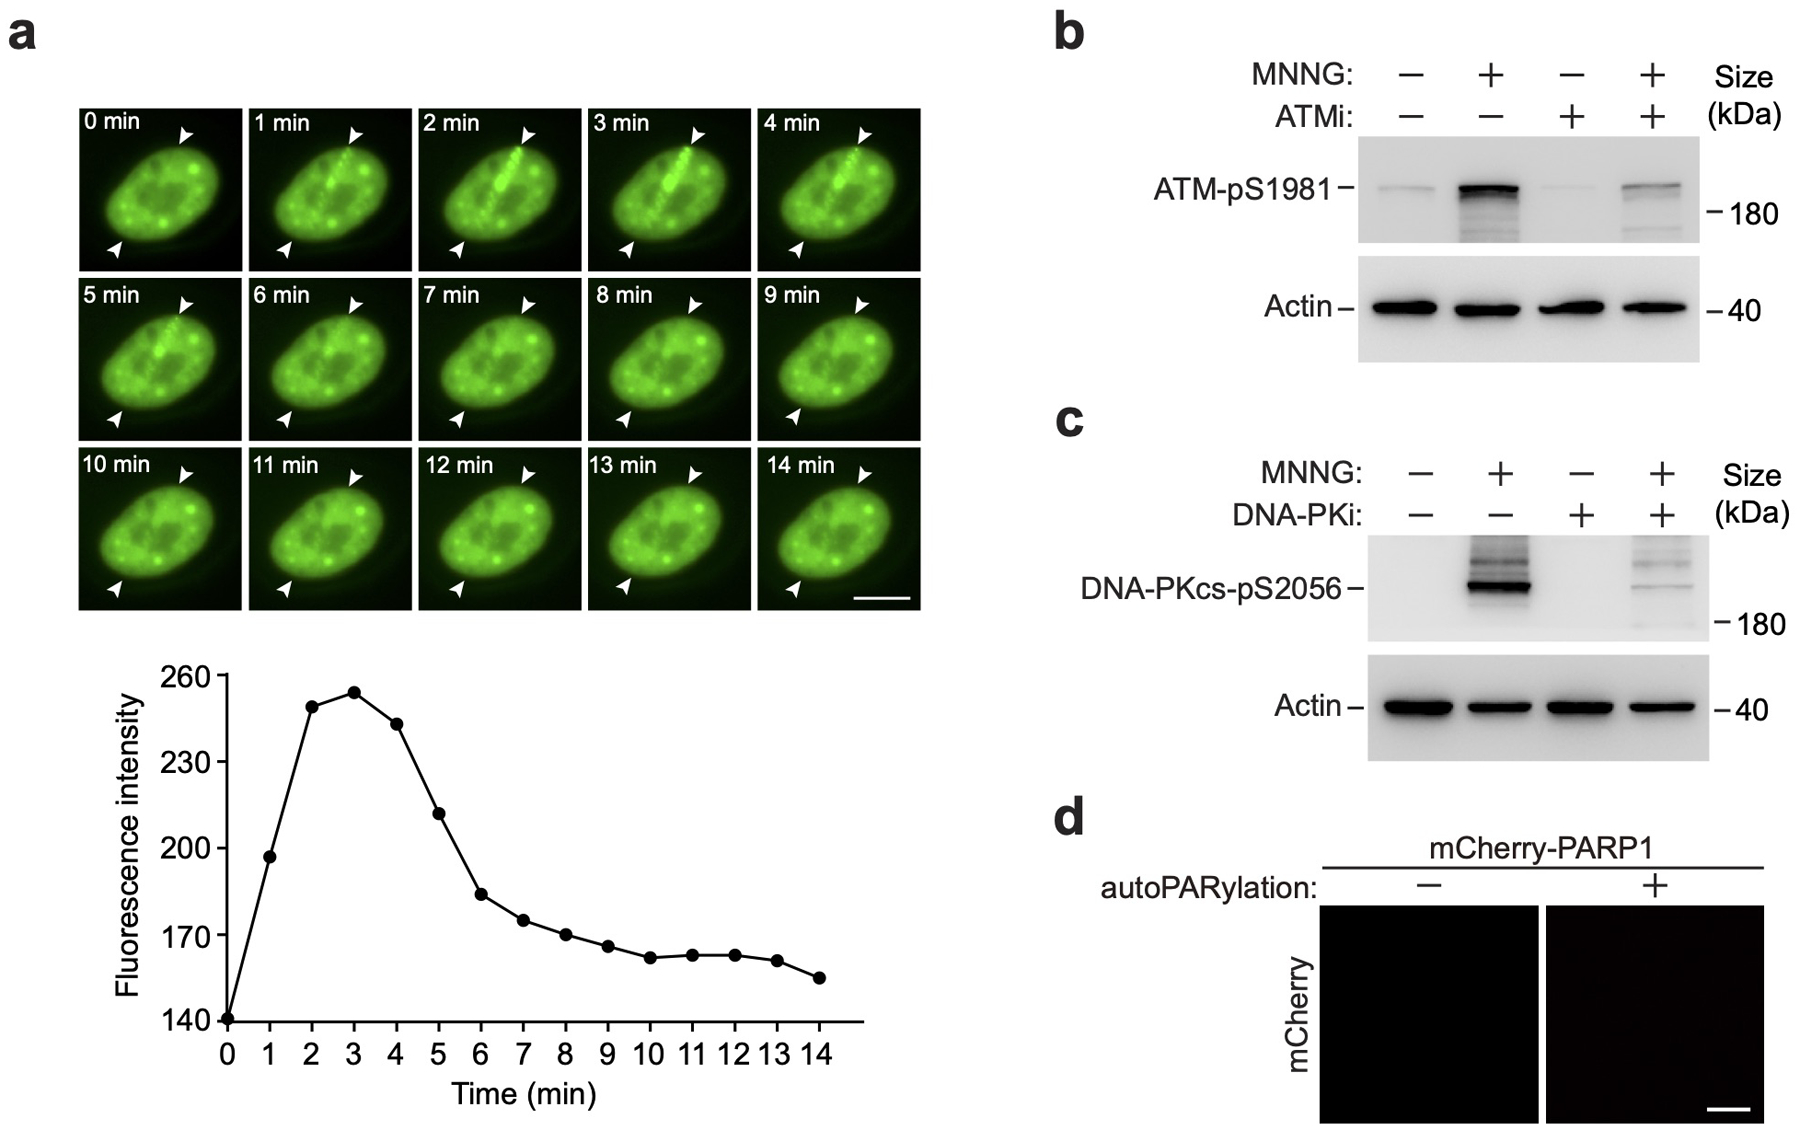
a, HeLa cells expressing GFP-CycT1 were subjected to laser microirradiation and examined with live-cell imaging at the indicated time points. The entry and exit points of the laser beam are indicated by arrowheads. Scale bar = 10 μM. Bottom: The relative intensities of GFP-CycT1 signals at the irradiation sites were measured at the indicated time points. b&c, HeLa cells were untreated or treated with MNNG or/and the inhibitor of ATM (ATMi) (b) or DNA-PK (DNA-PKi) (c) as indicated. Whole cell extracts were analyzed by Western blotting for the indicated proteins. d, Unmodified or in vitro PARylated mCherry-PARP1 (0.1 mg/ml) was subjected to droplet formation assay and examined by fluorescence microscopy for mCherry fluorescence. Scale bar = 10 μM. Experiments in a and d were repeated independently twice with similar results. All Western blots are representative of three independent experiments. Gel source data are available online.