
Figure 1. dECM microparticles generated by electrospray and experimental setup.
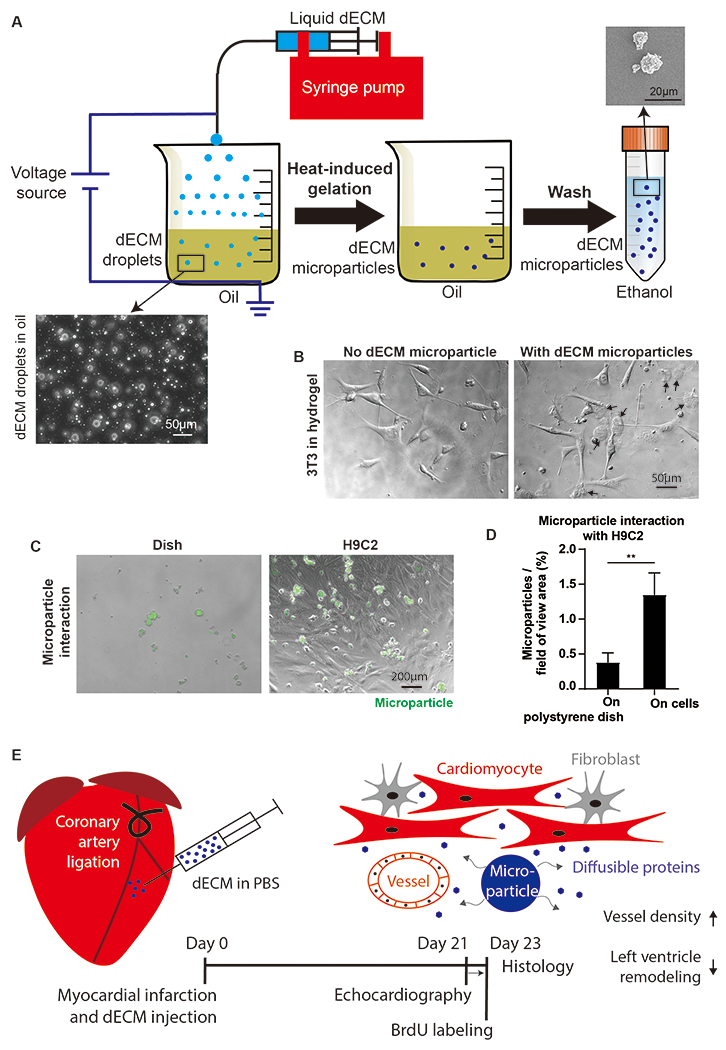
(A) Schematic of dECM microparticles fabrication. dECM droplets were generated by electrospray and stabilized in oil with surfactant. Liquid dECM droplets were gelled on hotplate and washed in acetone to remove oil and ethanol. The final solidified dECM microparticles were stable in ethanol. (B) 3T3 cells interaction with dECM microparticles. 3T3 cell protrusions were observed to make contact with dECM microparticles. (C) Microparticles captured by H9C2 cells. (D) Microparticles were labeled by WGA-Alexa Fluor 488 for quantification of fluorescent surface area after incubation on H9C2 cells and on polystyrene dish. (E) Experimental setup. dECM microparticles (resuspended in PBS) were injected into the infarct area immediately after coronary artery ligation in juvenile mice. Echocardiography was measured 21 days post-surgery. After 3 days BrdU labeling, mice hearts were harvested for histological analysis. (Panel D: n=3, t-test, **p<0.01. All data presented as mean ± SD. Black arrows in panel E indicate microparticles.)