
Figure 1. Exosomes generated by cells treated with bafilomycin, DFP, or both reflect changes seen in the cells themselves.
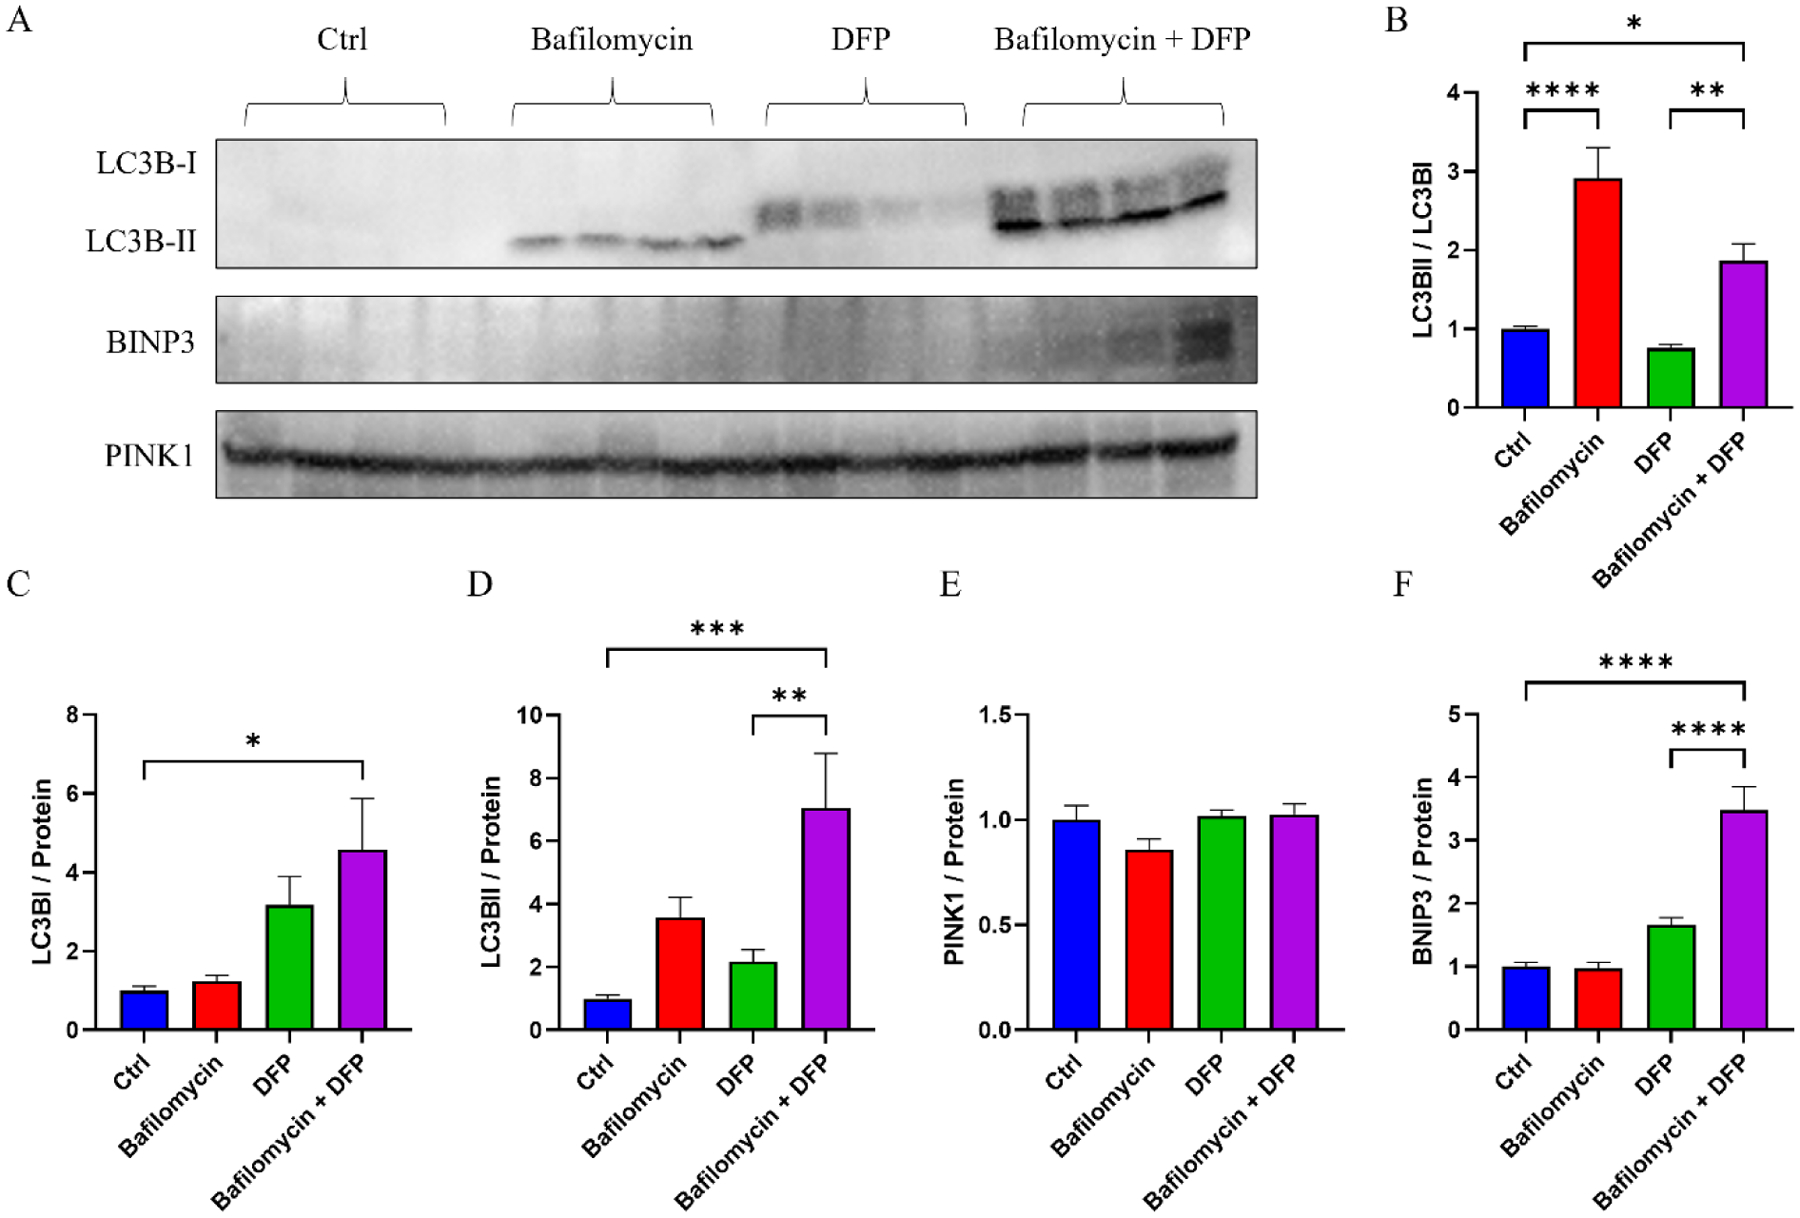
(A) Western blots of exosome LC3BI, LC3BII, BNIP3, and PINK1 proteins from SH-SY5Y cells treated with bafilomycin, DFP, or both. (B) LC3BII/LC3BI ratios. (C) LC3B1 protein levels. (D) LC3BII protein levels. (E) PINK1 protein levels. (F) BNIP3 protein levels. Data represent means ± SEM, *p < 0.05, ***p < 0.001, ****p < 0.0001, as analyzed through one-way ANOVA with Tukey’s multiple comparisons test; significant changes relative to the no-treatment control (Ctrl), and between the DFP and bafilomycin+DFP conditions, are indicated.