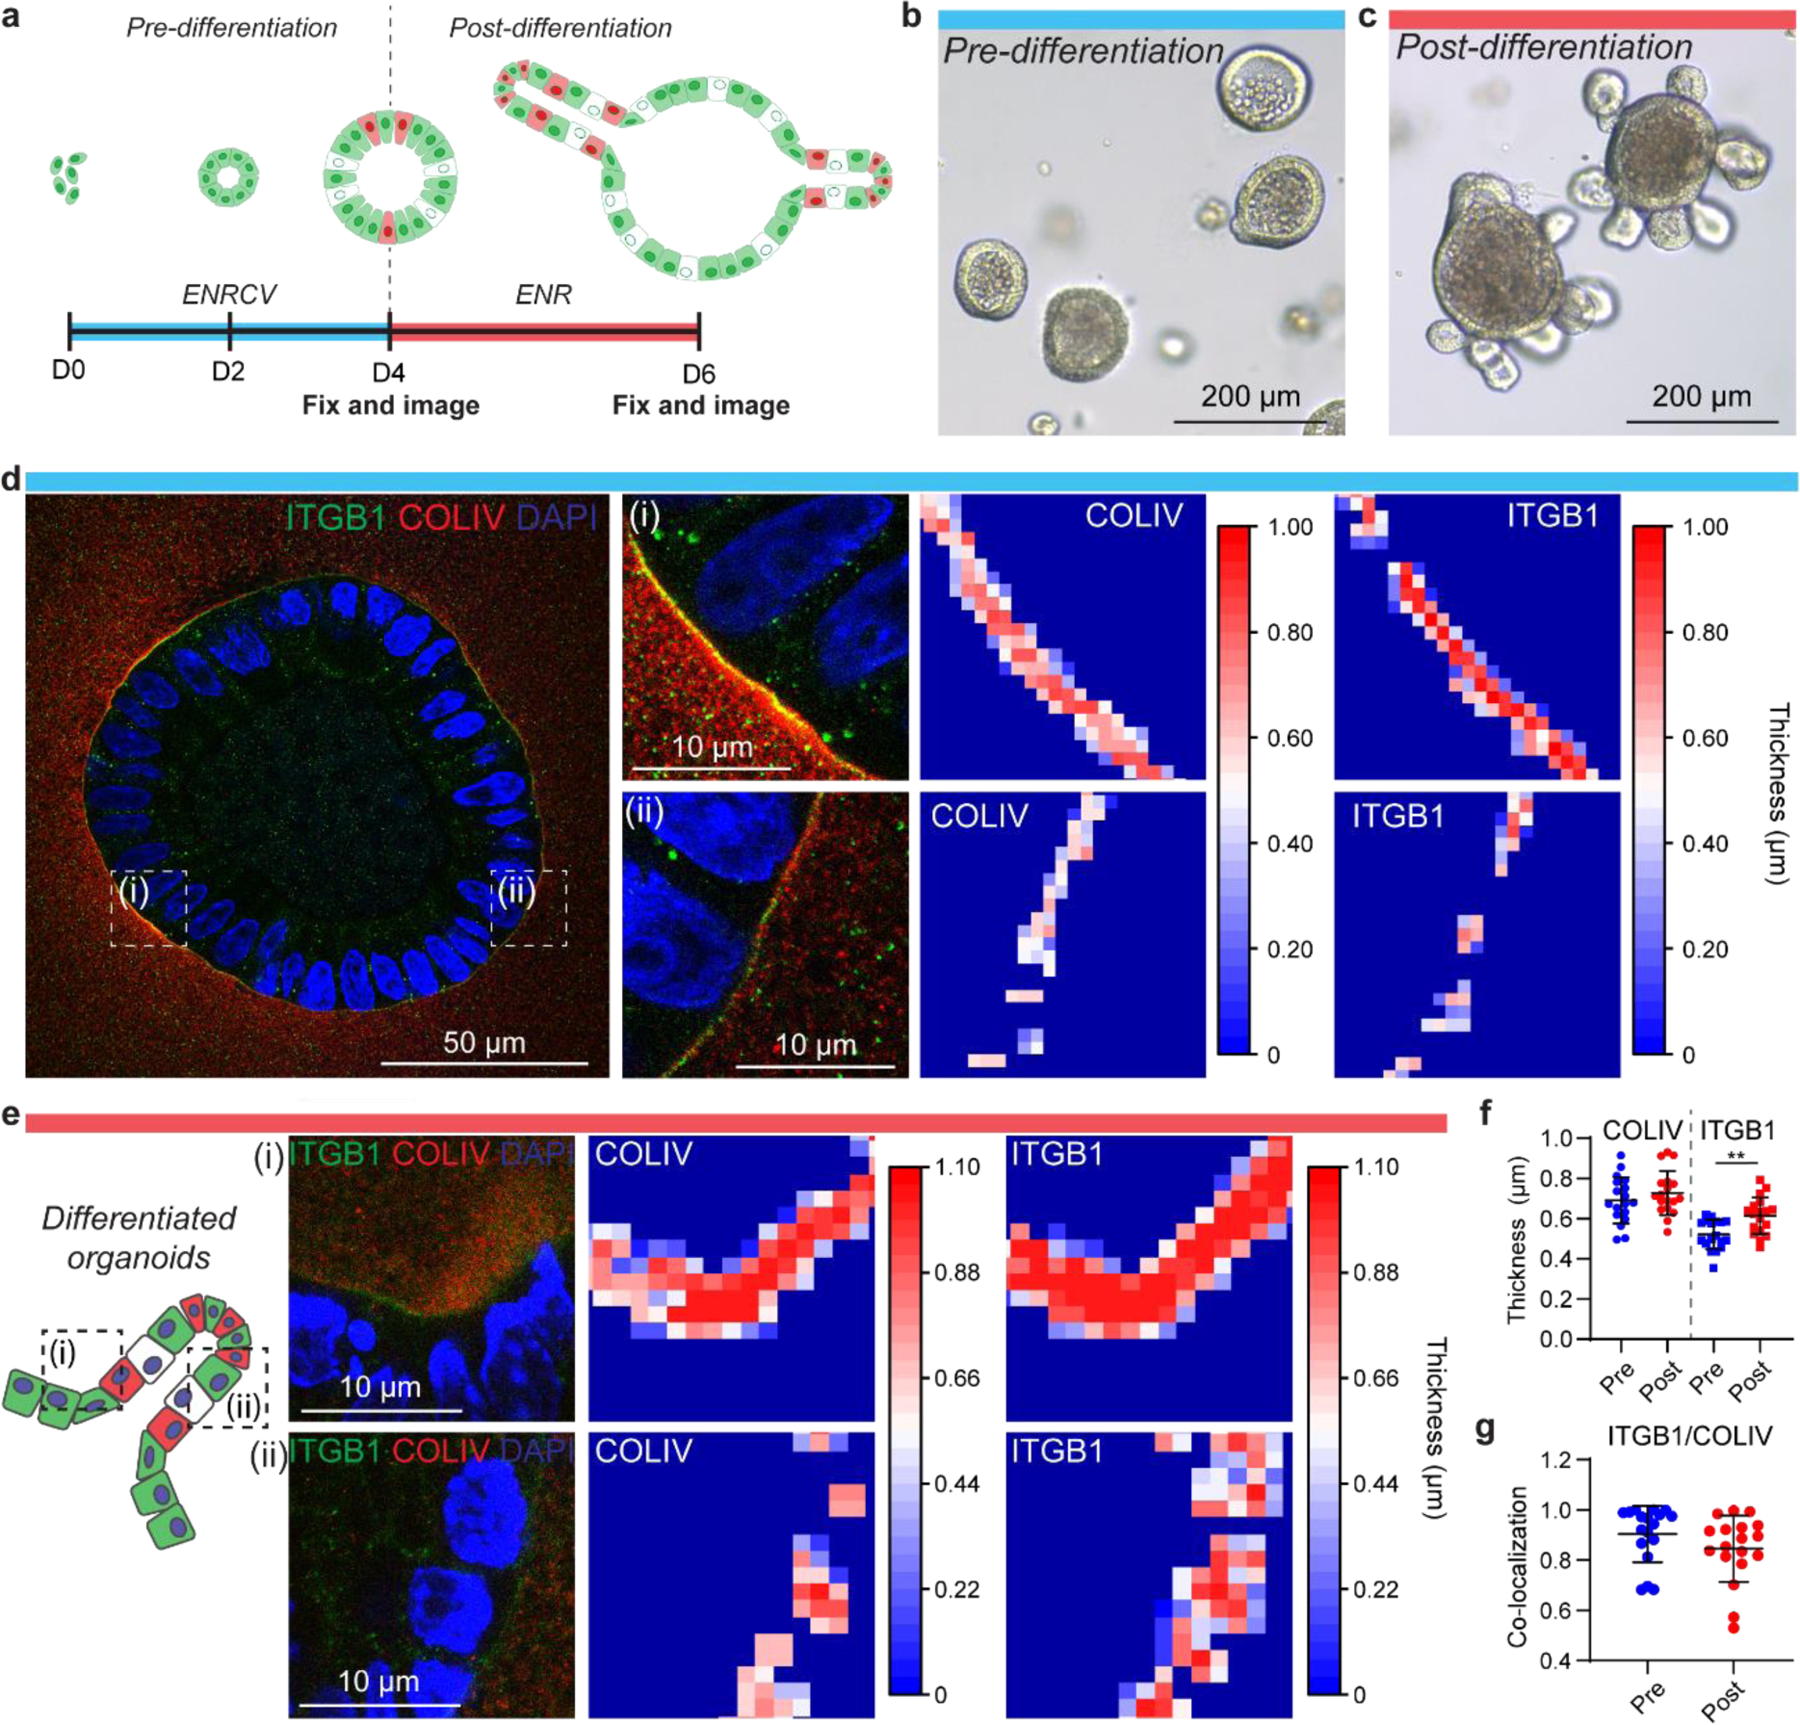
Figure 3. PhotoExM of cell-ECM interactions of organoids cultured in Matrigel.

(a) Timeline of organoid growth. Organoids are generated starting from a population of single ISCs. For the first 4 days, cells were cultured in ENRCV media, favoring maintenance of stemness (“pre-differentiation”). On day 4, the media composition was changed to ENR to promote cell differentiation and crypt formation (“post-differentiation”). (b) Pre-differentiation, spherical organoids at day 4 in culture. (c) Post-differentiation organoids, containing crypts at day 6 in culture. (d) PhotoExM imaging of pre-differentiation organoids. Insets (i) and (ii) shows regions of high and low COLIV/ITGB1 thickness, respectively. (e) PhotoExM of post-differentiation organoids. The hinge region adjacent to an intestinal crypt (i) shows thicker COLIV/ITGB1 compared to the crypt region (ii). (f) Global quantification of the mean thickness of COLIV and ITGB1 in pre- and post-differentiated organoids. n = 18 organoids per condition. Graph presented as mean +/− s.d. ** p < 0.01. (g) Co-localization of ITGB1 and COLIV. Reported values are Mander’s coeffecient for the overlap of ITGB1 and COLIV. n = 18 organoids per condition. Graph presented as mean +/− s.d.
