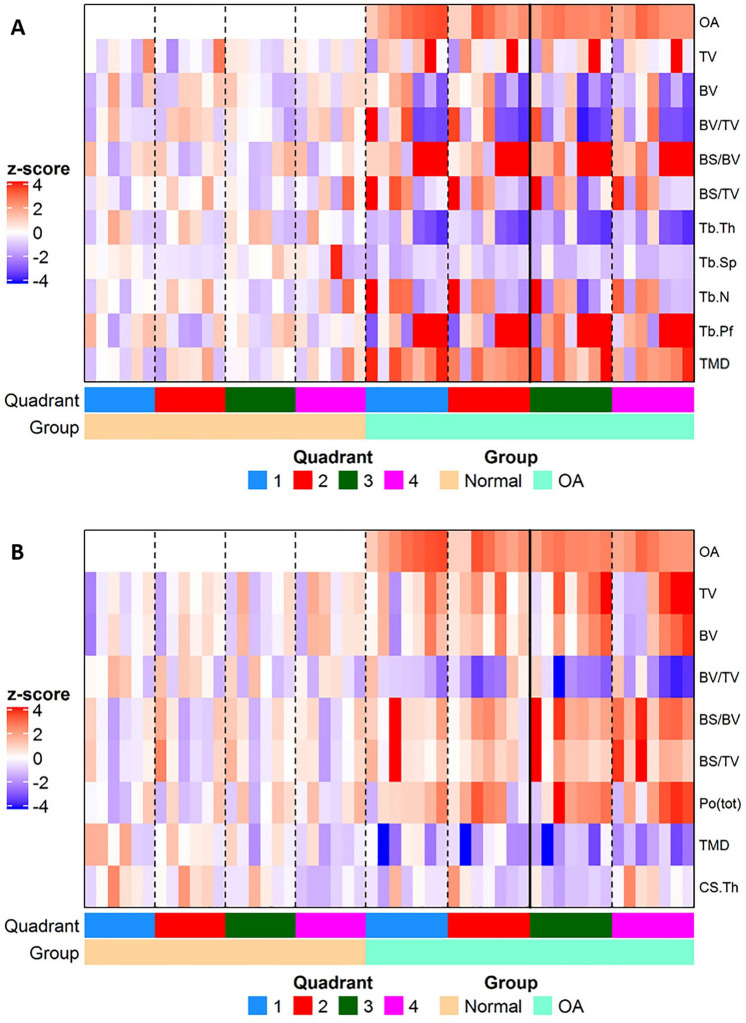
Figure 4.
Heat maps showing differences in structural parameters of (A) trabecular bone and (B) subchondral plate in the four anatomical regions defined in both OA and non-OA samples. Patients were grouped according to disease status; all measurements were standardized (subtract mean and divide by standard deviation of non-OA controls) as indicated by z-scores (deeper red indicated higher readout and deeper blue indicated lower readout).

