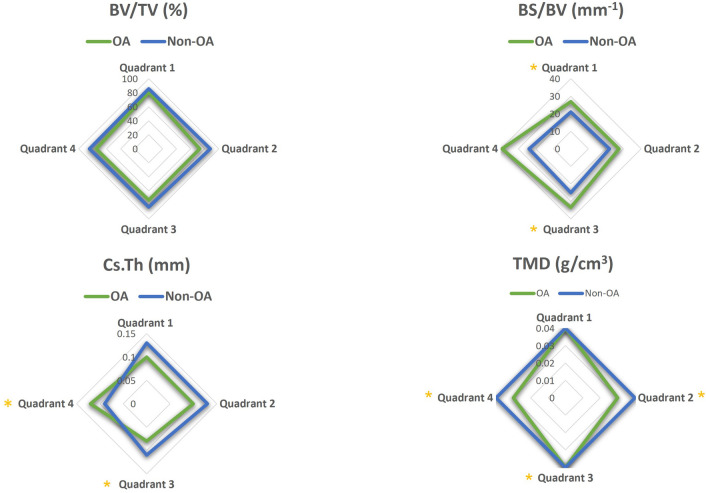
Figure 7.
Regional distribution of the median value for the cortical plate microstructural properties in the OA (green) and non-OA (blue) patients. No significant differences were found when cortical plate in different anatomical regions was compared within the OA and non-OA patients. (*) shows when there is a significant difference between OA and non-OA patients (p < 0.05). BV/TV: bone volume fraction; BS/BV: specific bone surface; Cs.Th: cortical thickness; TMD: tissue mineral density.

