Figure 1.
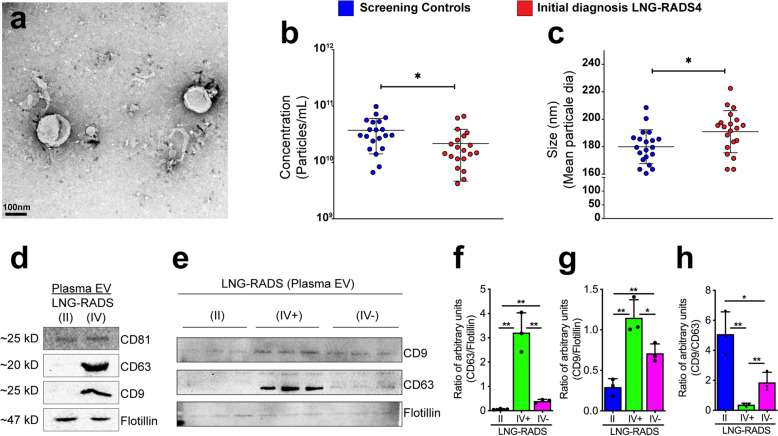
CD9 and CD63, but not CD81, are enriched on NSCLC EV. (a) Representative transmission electron micrograph of the isolated extracellular vesicles (EV). (b,c) Nanoparticle tracking analyses (NTA) data showing EV concentrations (particles/mL) (b) and size distribution (c). One-way ANOVA analysis was performed to determine statistical significance, *< 0.05. (d) Western blot image showing abundance of EV markers (CD81, CD63, CD9, and Flotillin) in EV isolated from blood samples obtained from screening controls (LNG-RADS II) or LNG-RADS IV individuals. (e) Western blot images from triplicate samples showing CD9 and CD63 protein levels in EV extracted from LNG RADS II or confirmed cancer patients (IV+) plasma or disease-free LNG-RADS IV (IV−) individuals. Flotillin protein levels are used as loading controls. These experiments are shown in triplicates. (f,g) Relative quantification of CD9 and CD63 protein levels in Western blot shown in (e). Proteins levels are denoted as ratio of pixel intensities mean values quantified from each of the three replicates and normalized to Flotillin. (h) Ratio of CD9:CD63 protein band intensities presented in (e). Quantification of band intensities (pixels) was performed using ImageJ. Bars represent data as mean ± SD. p values are derived from t-test. *p < 0.05, **p < 0.01, ***p < 0.001.

