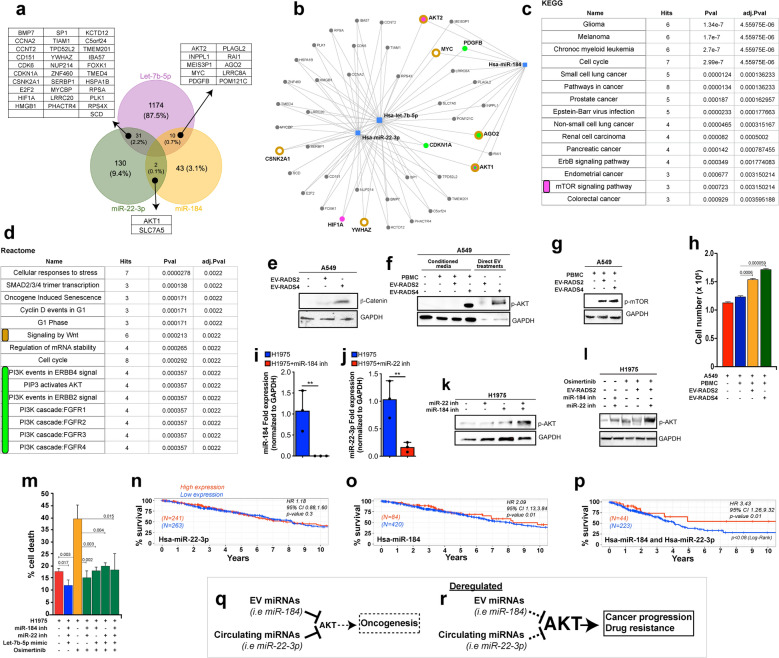
Figure 3.
Let-7b-5p, miR-184, and miR-22-3p converge on AKT/mTOR and WNT/β-catenin therapy resistance pathways. (a) Venn diagram showing the number unique of shared protein targets between the selected miRNAs. (b) MIRNET star-network showing proteins that are targeted by at least two of the three miRNAs (blue squares). (c,d) KEGG (c) or Reactome (d) classification analyses of the identified proteins show a convergence onto PI3K-AKT-mTOR (c, magenta label and d green label) and WNT/β-catenin (d, brown label) signaling pathways. The underlying target genes are shown in corresponding color in “b”. (e) Western blot image from A549 cells treated with equal quantity of EV from cancer patients or from high-risk screening controls. Blots were stained against β-catenin to detect WNT signaling levels or GAPDH as a loading control. (f,g) Western blot images from A549 cells cultured in standard media or media conditioned with PBMC in the absence or presence of patients EV (f, lanes 1–4). Also, A549 cells were treated directly with cancer patients or control EV (f, lanes 5 and 6). Blots were stained against phospho-AKT1 (f) or phospho-mTOR (g) or GAPDH as a loading control (f,g). A549 cell numbers from supernatant transfer experiments (f, lanes 1–4) are shown in “h” as average cell numbers from triplicate experiments. Error bars denote SD values. P values are derived from student t-test analyses. (i,j) qPCR data showing mean expression fold changes of miR-184 (i) or miR-22-3p (j) in H1975 cells transfected with miR-184 (i) or miR-22-3p inhibitors (j) (blue bars) compared to untreated H1975 control cells (red bars). Expression was normalized to GAPDH. (k) Western blot images from H1975 cells left untreated or treated with miR-22-3p or miR-184 inhibitors and blotted against phospho-AKT1 or GAPDH (loading control). (l) Image of a Western blot from untreated H1975 cells or H1975 cells treated with equal portions of EV from screening controls (RADS-II) or with inhibitors against miR-22-3p and/or miR-184 inhibitors followed with Osimertinib (100 nM) treatments. Western blots were stained against phospho-AKT or GAPDH (loading control). (m) Graph showing the proportion of H1975 cell death across the indicated conditions using Trypan blue exclusion assays. These cell death assays were performed in triplicates and the results are shown as the average proportion (percentage) of dead cell across replicates for each treatment conditions. Error bars denote standard deviations and p values were derived from t-tests. (n–p) Survivorship comparison data using miR-184 and/or miR-22-3p expression data in TCGA-LUAD and the Bioconductor tool TCGA Biolinks RTCGA R packages. The “surv_cutpoint” function of the “survminer” R package was used to identify high versus low expressing patients’ samples for miR-22-3p (n) or miR-184 (o) or both (p) in Cox regression analyses. Survminer uses selected rank statistics to determine the optimal cut-point of a continuous variable in an unbiased manner. The related bioinformatics and statistics are presented in Supplementary Information 1. (q,r) proposed model summarizing the role of mir-184/mir-22 in Osimertinib drug response. EV (mir-184) and circulating (mir-22) plasma miRNAs cooperatively target and modulate AKT activity. (q) Cancer-free high-risk individuals up-regulate EV mir-184 and circulating mir-22, keeping AKT levels generally low. In the context of genetic driver mutations, this low AKT activity delays oncogenesis. Similarly, cancer patients with high EV mir-184 and circulating mir-22-3p maintain AKT below an activity threshold required for AKT-mediated drug resistance, leading to positive drug response. However, AKT baseline activity is elevated in patients with low mir-184/mir-22 levels such that even a modest stimulation of AKT drives AKT above the drug-resistance activity threshold, leading to relapses and poor clinical response (r).

