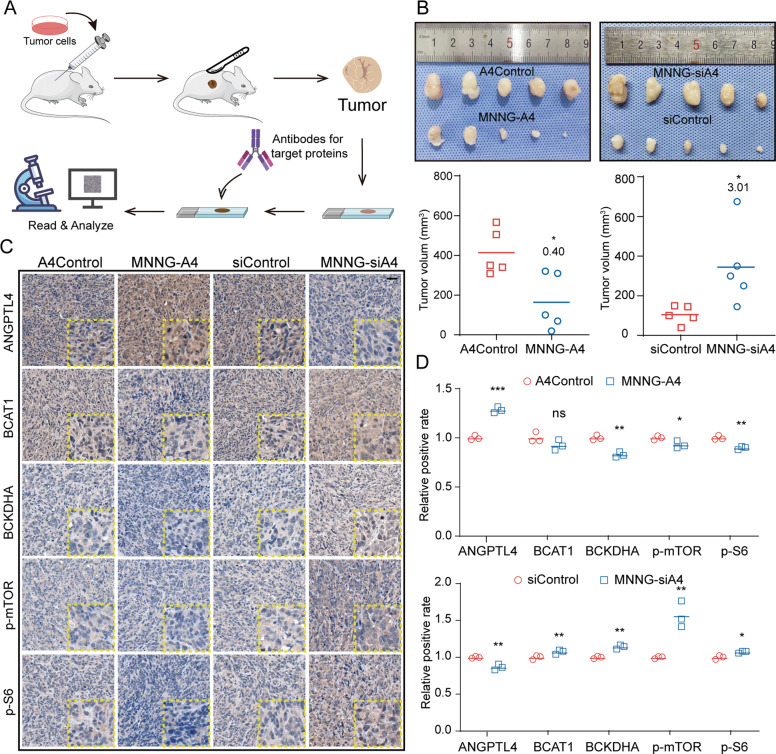
Fig. 7. ANGPTL4 negatively regulates OS progression via the BCAA/mTOR axis in vivo.
A Diagram illustrating the method for constructing the subcutaneous tumor model and IHC analysis. B Images of excised tumors from the nude mouse subcutaneous tumor model and quantitation of tumor volume (N = 5, *p < 0.05 vs. the control group). C, D Immunohistochemical staining of ANGPTL4, BCAT1, BCKDHA, p-mTOR, and p-S6 in xenografts of OS tissue from the subcutaneous tumor nude mouse model (C, scale bars, 25 μm) (N = 3, ns p > 0.05, *p < 0.05, **p < 0.01, ***p < 0.001 vs. the control group).

