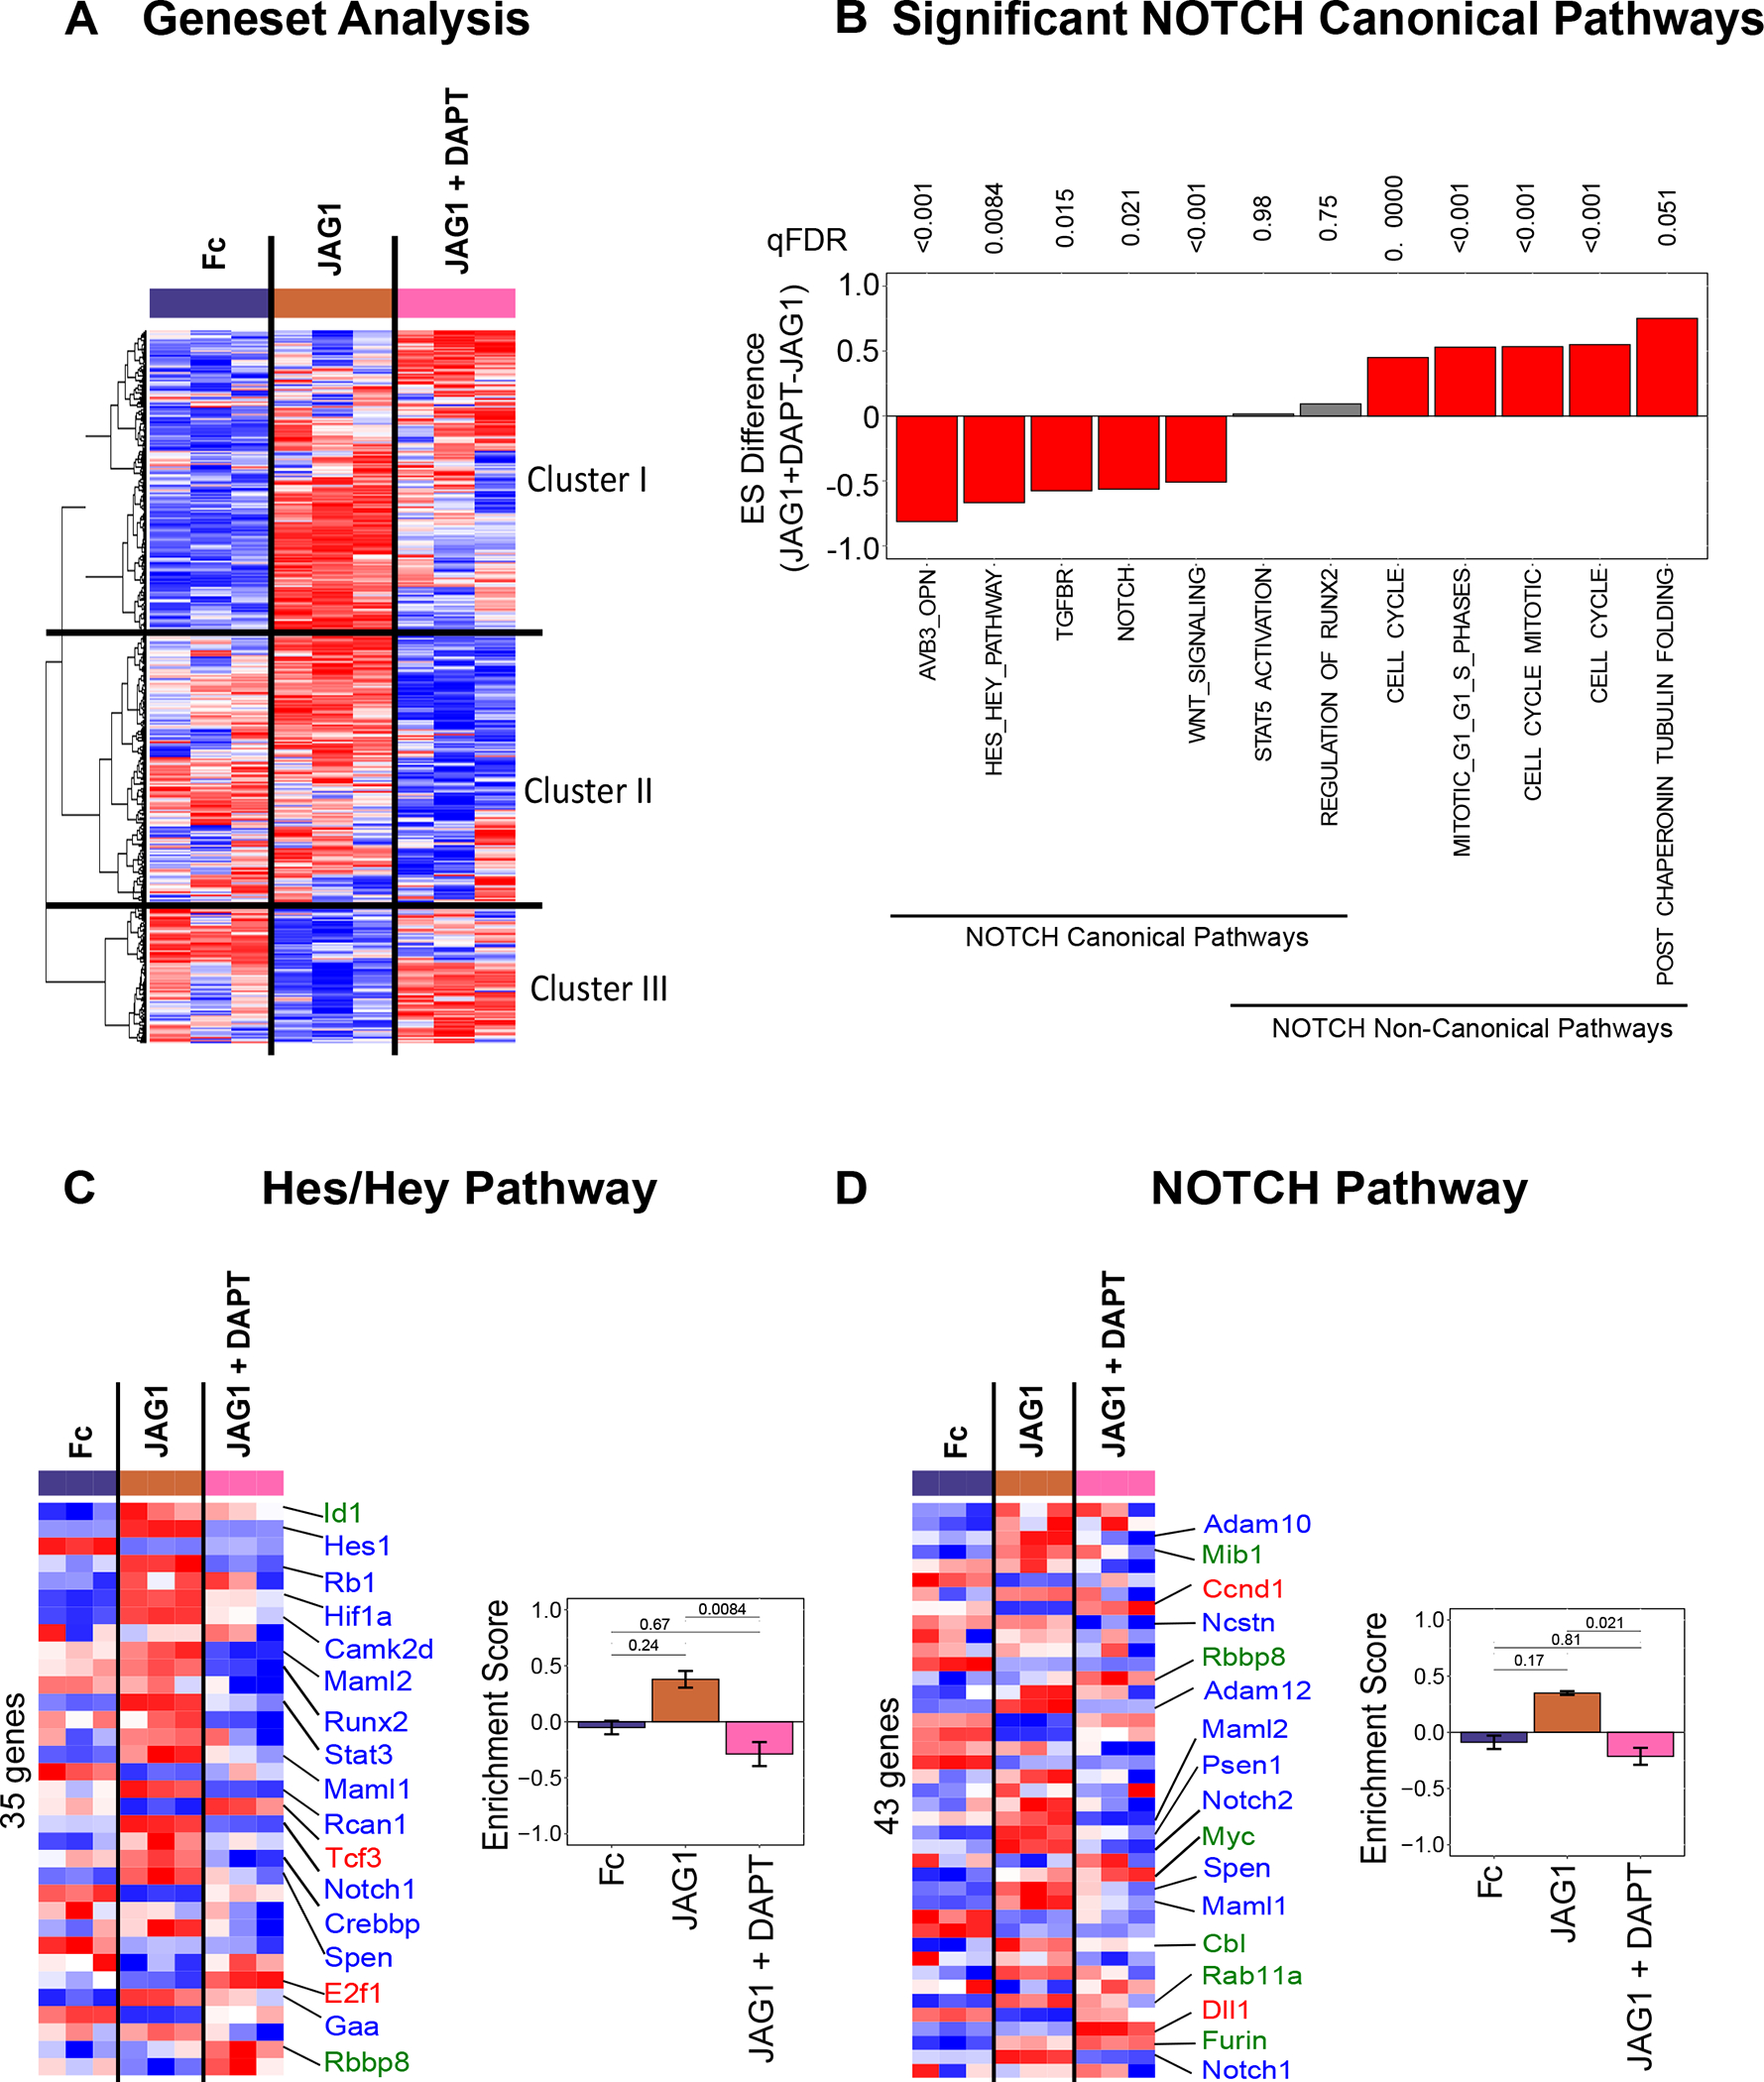
Figure 4: JAG1 enriches canonical NOTCH gene sets.

(A) Gene set variation analysis (GSEA) quantified differences in 2199 gene sets. Clustering analysis (Euclidean + Ward’s minimum variance) revealed 3 clusters: Cluster I involves gene sets that were elevated in the JAG1-treated group, Cluster II shows gene sets that were downregulated in JAG1 + DAPT-treated samples and Cluster III indicates gene sets downregulated in JAG1 alone treated cells. (B) GSVA pathway analysis of selected pathways from CNC cells that were treated with JAG1-dynabeads complex (5.7 μM), with or without DAPT and Fc-dynabeads complex (5.7 μM) revealed various pathways up- and downregulated by JAG1 compared to JAG1 + DAPT. The Hes/Hey pathway (C) and the NOTCH pathway (D) were upregulated canonically and downregulated non-canonically downstream of JAG1. qFDR values are reported from a permutation analysis. Heatmap labels indicate selected genes whose expression levels are significantly different (p < 0.05) (red, blue, green fonts) in JAG1-treated groups compared to the Fc-treated sample. Expression levels of selected genes are significantly upregulated (Red font), downregulated (Blue font) or unchanged (Green font) in JAG1 + DAPT treated cells compared to JAG1 treated cells. See Suppl. Table 1–2 for entire list of genes shown in heatmaps from C & D.
