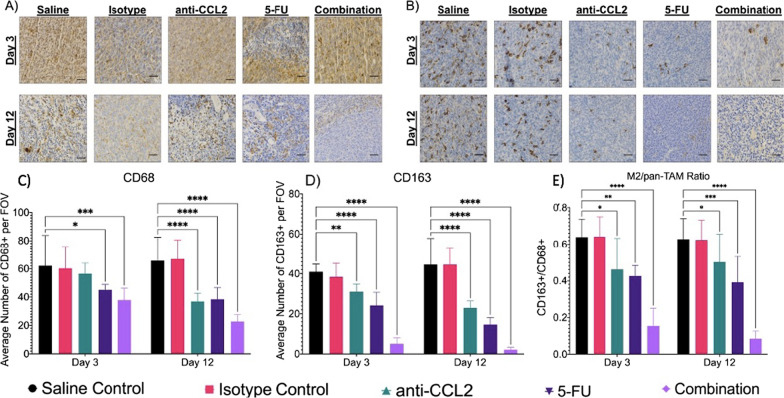
Fig. 4.
Combination therapy shows decrease in total and M2 macrophage recruitment. A Total TAM recruitment through IHC quantification using CD68 (40X, scale bars are 20 μm). B M2 TAM recruitment through IHC quantification using CD163. The average number of positively stained C CD68 (n = 27 FOVs per group) and D CD163 (n = 27 FOVs per group). TAMs were counted per FOV. Then the E ratio of M2 TAMs to total TAMs was calculated. A mixed effects model was used to calculate statistical differences (*p ≤ 0.05, **p ≤ 0.01, ***p ≤ 0.001, ****p ≤ 0.0001). Plots created in Prism (GraphPad)

