
Figure 2.
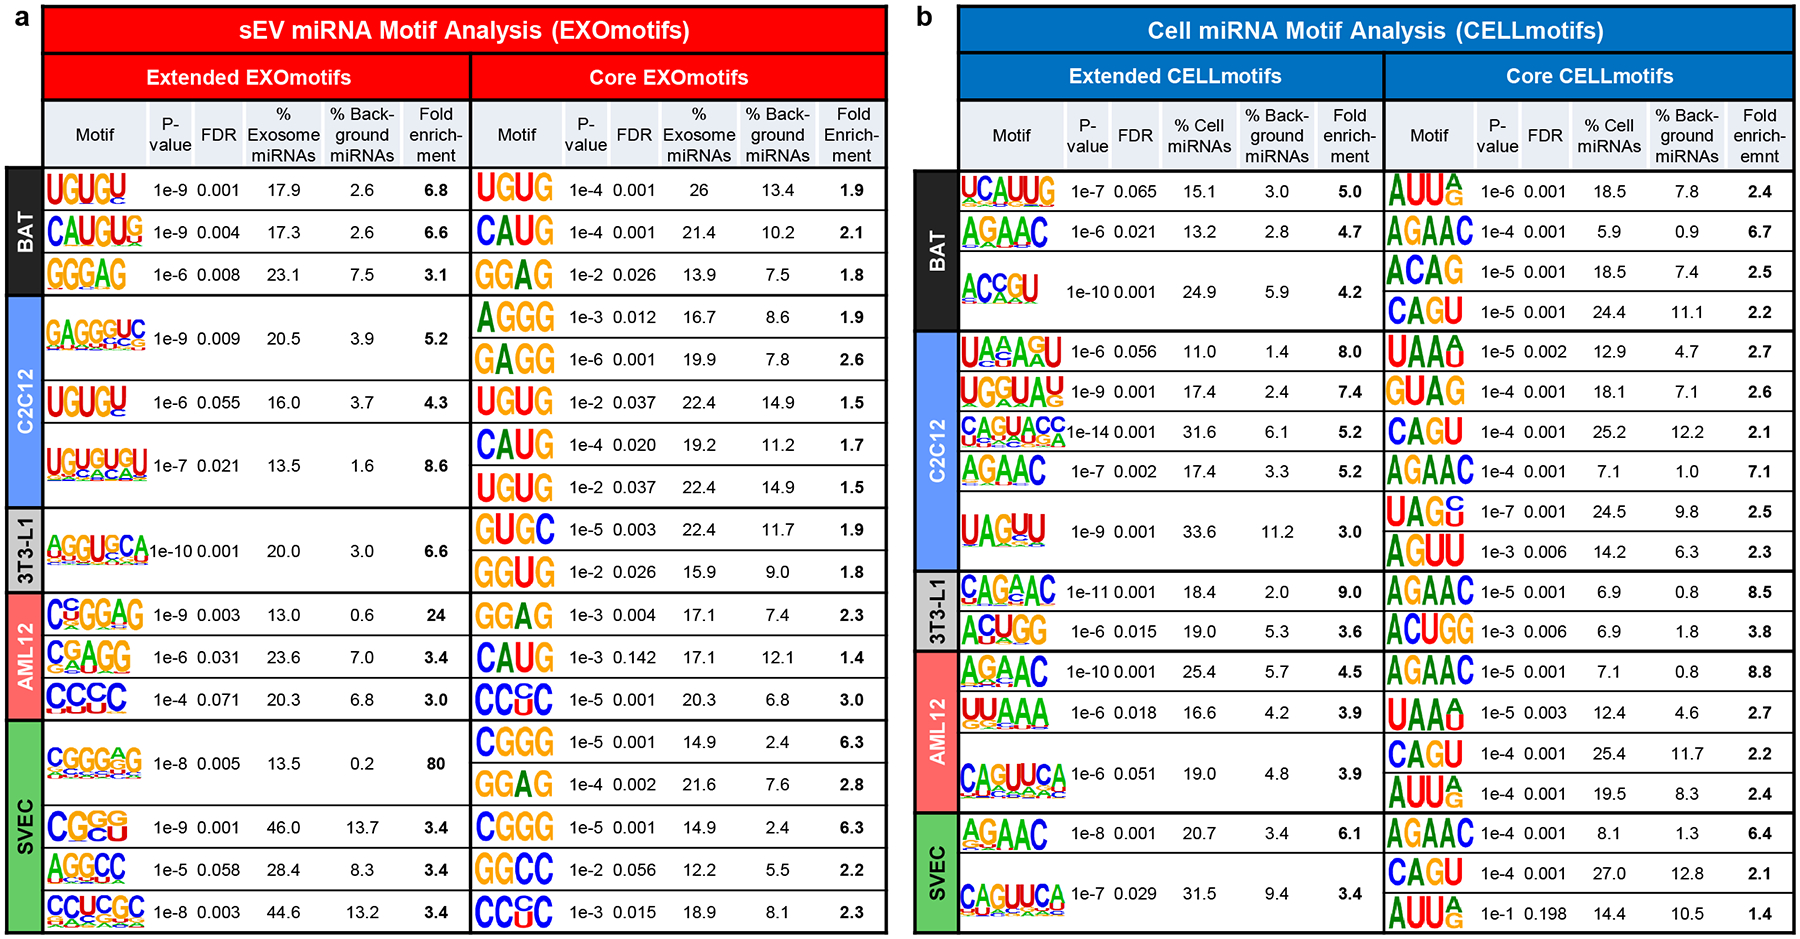
Motifs over-represented in miRNAs preferentially sorted into sEV/exosomes (EXOmotifs) or cell retained (CELLmotifs) for each cell type.
a) Table showing the sEV/exosomal motifs (EXOmotifs) identified for each cell type in their extended version (left) and core version (right). For each motif, the P-value, false discovery rate (FDR), the percentage of miRNAs significantly enriched in exosomes/sEV that contain the motif, the percentage of miRNAs not enriched in exosomes/sEV containing the motif (background) and the fold-enrichment as the ratio between the previous two columns are displayed.
b) Table showing the cell retention-associated motifs (CELLmotifs) identified for each cell type in their extended version (left) and core version (right). Calculated are as in panel a.