
Fig. 1.
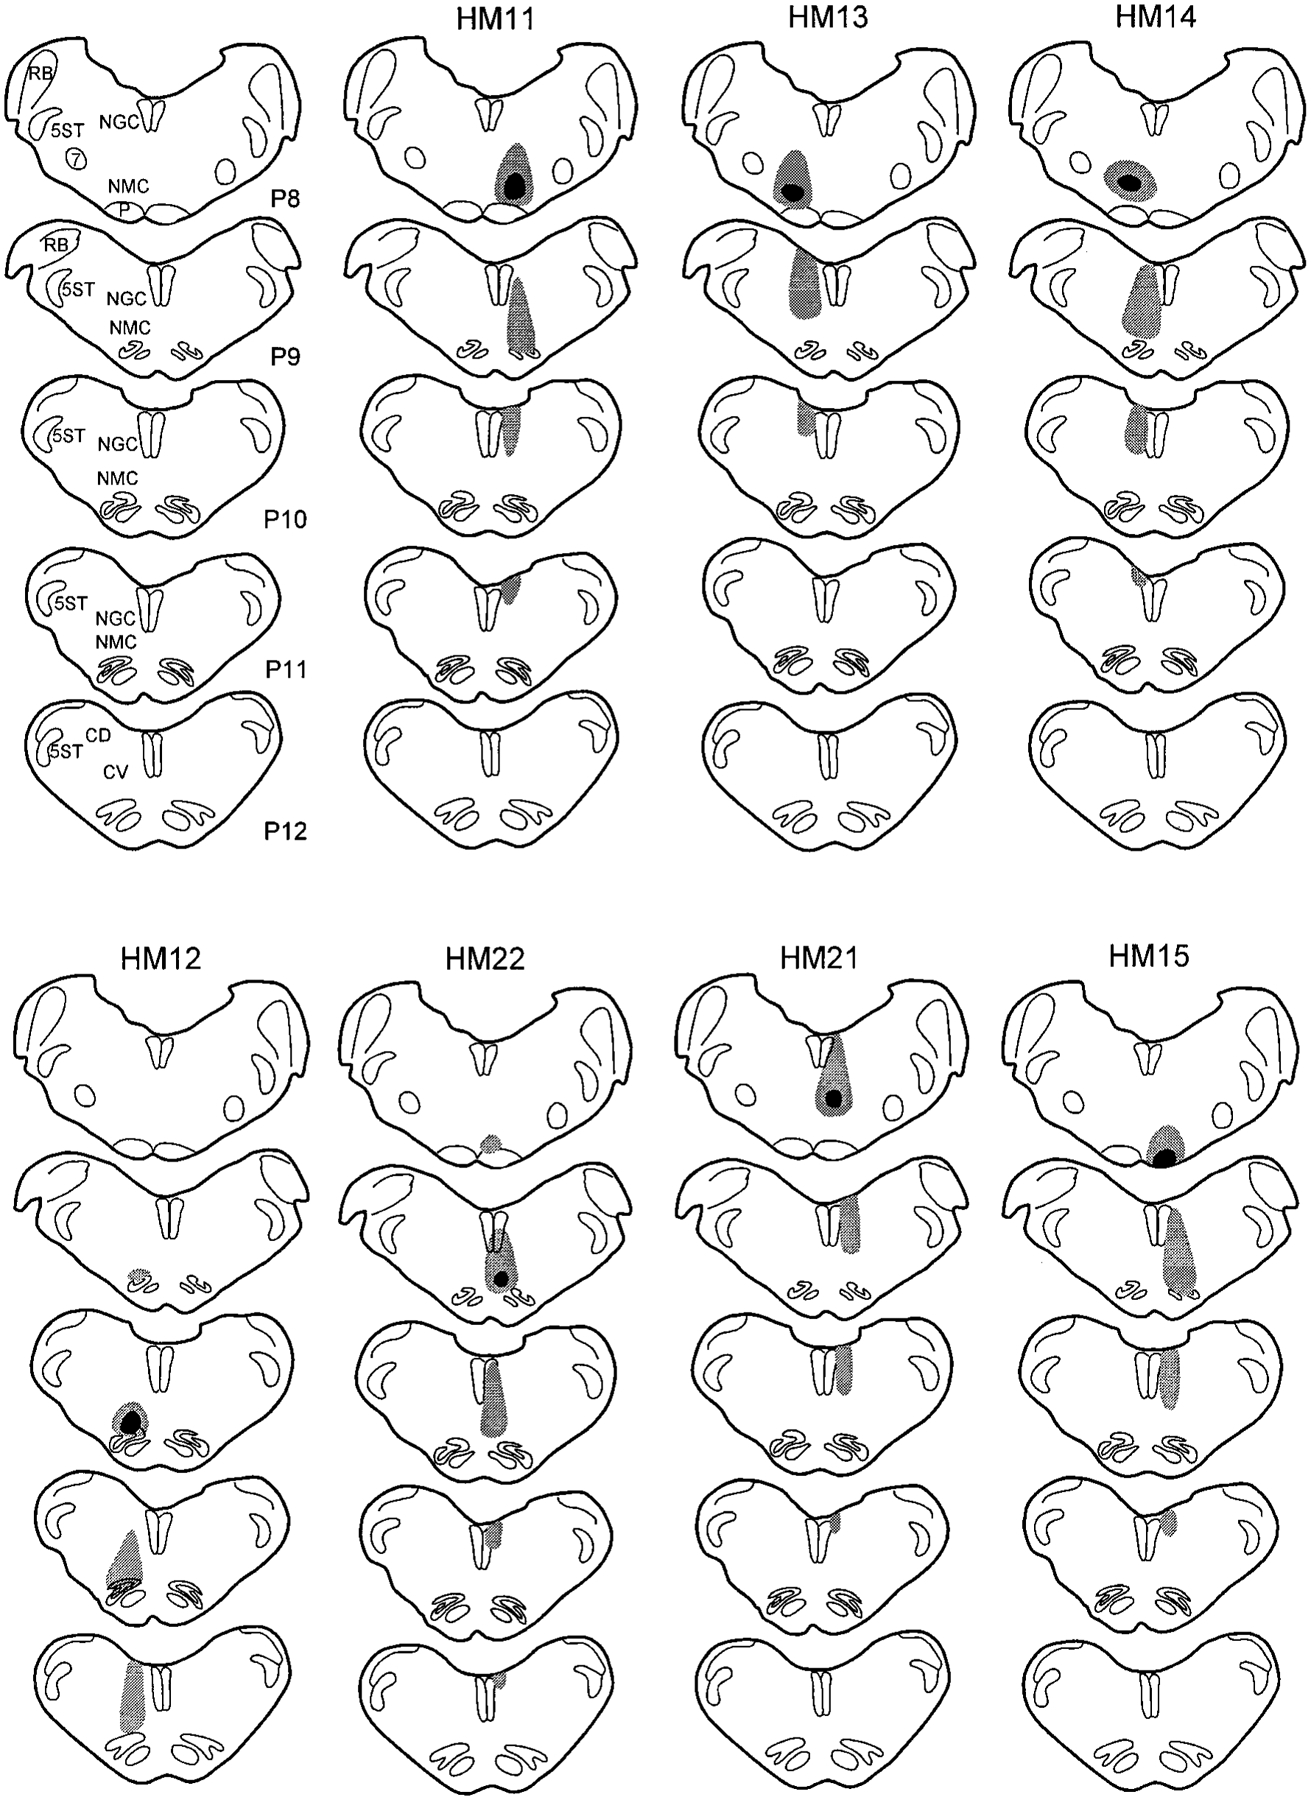
Coronal sections show the wheat germ agglutinin–horseradish peroxidase injection sites in seven cats. The black areas represent the injection centers, and gray areas represent the areas of diffusion and needle tract. P, millimeters posterior to stereotaxic 0. For abbreviations, see list.