
Fig. 5.
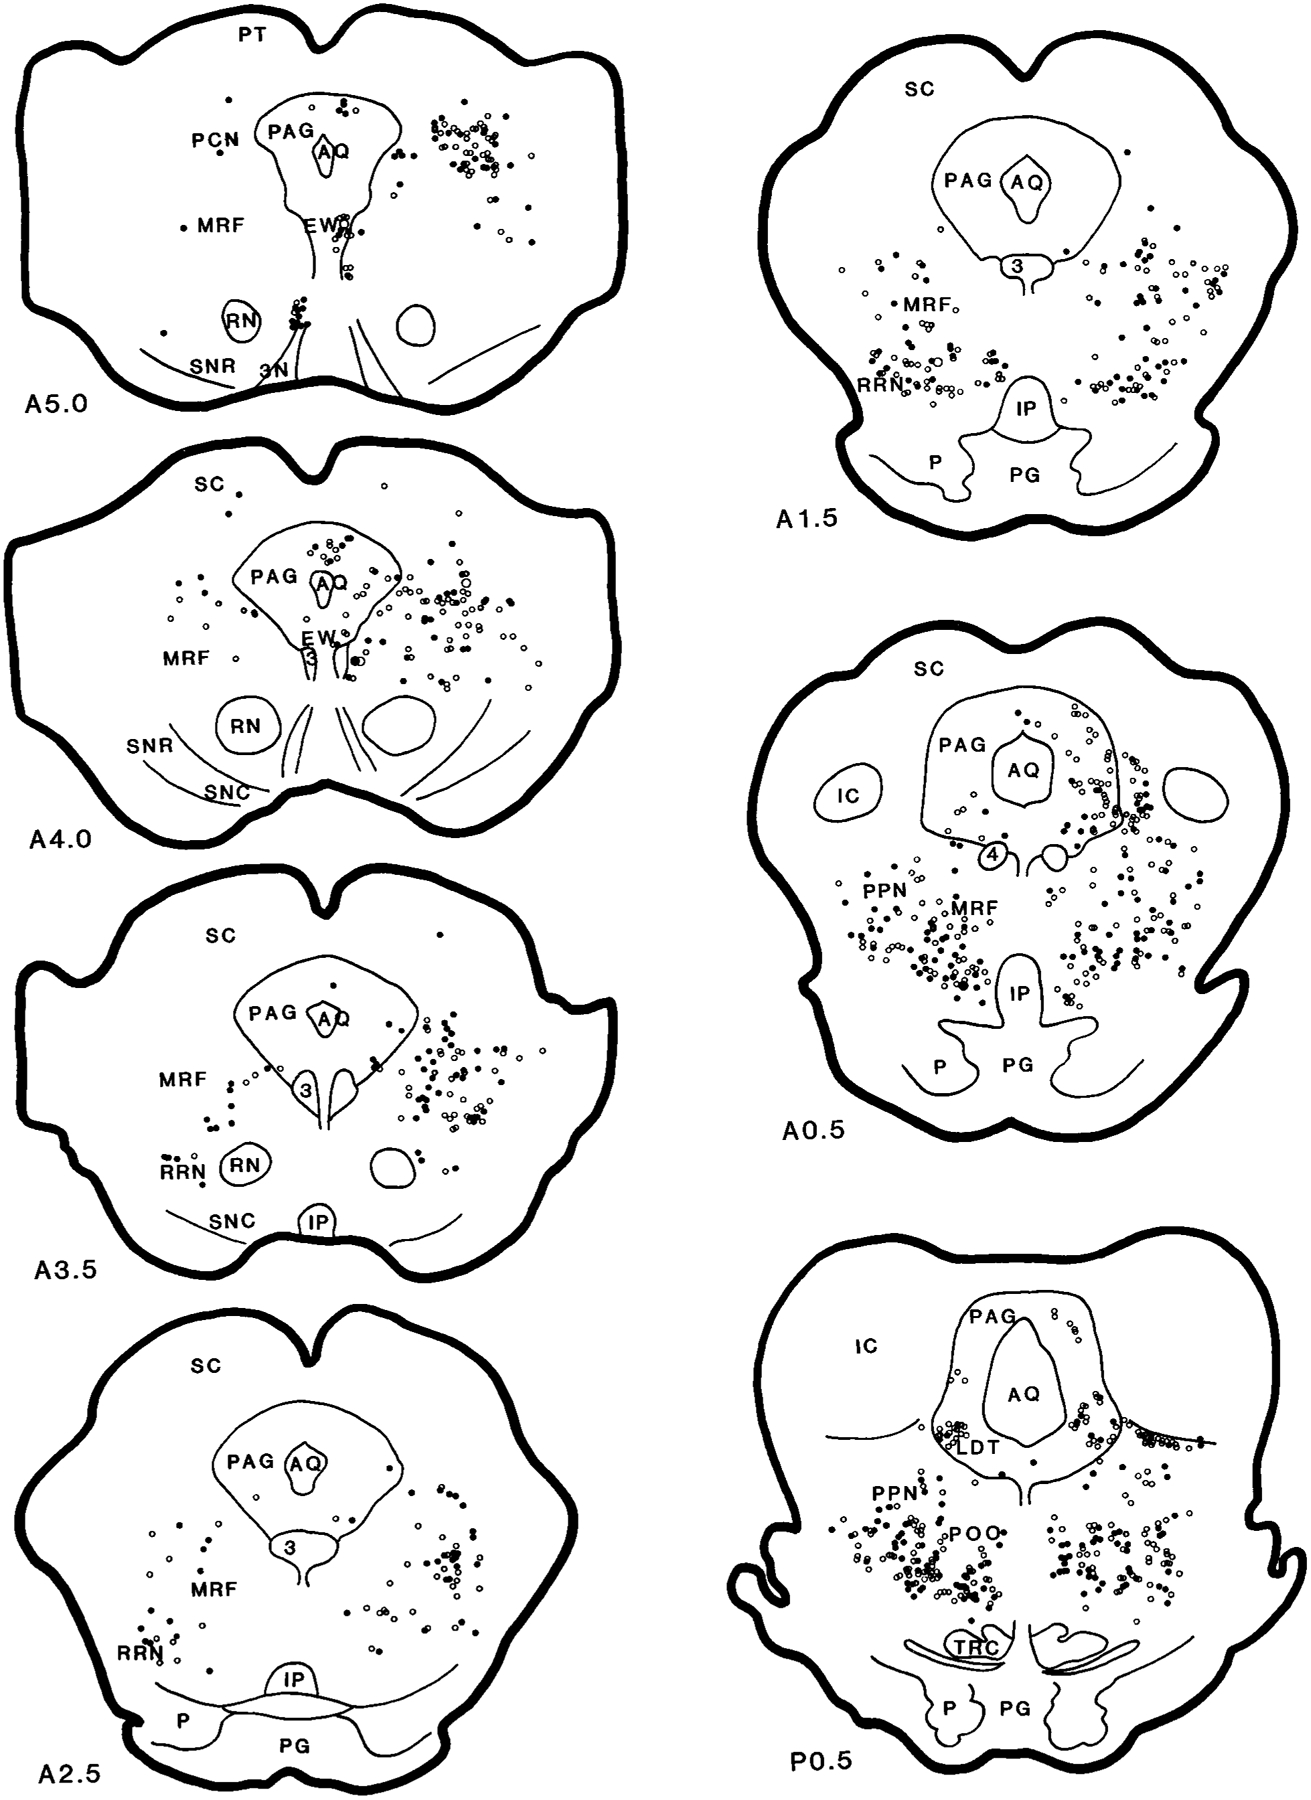
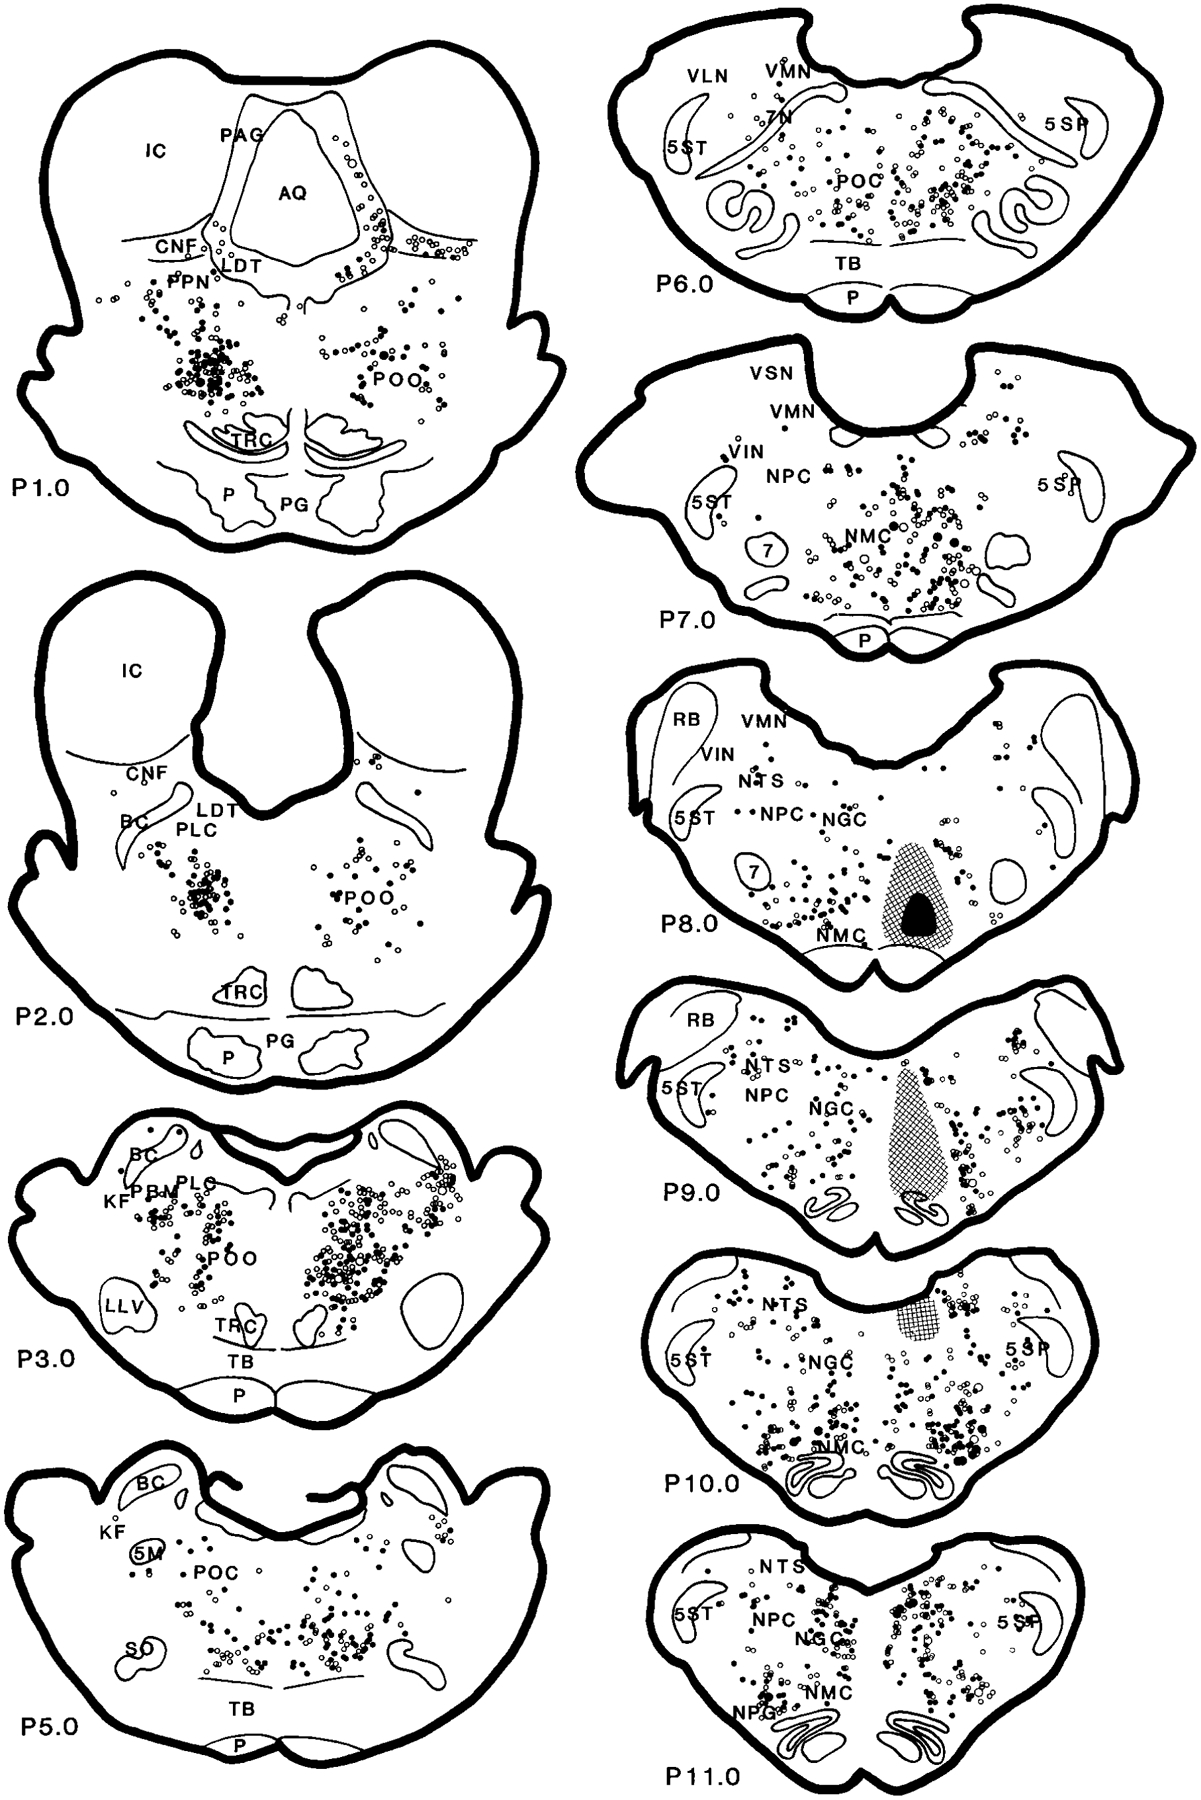
Serial coronal sections showing the distribution of the projection neurons from the brainstem to the nucleus magnocellularis (case HM11). The sections were reconstructed according to Berman’s atlas (1968). Anatomical nomenclature was based on that of Taber (1961) and Berman (1968). Open circles represent wheat germ agglutinin–horseradish peroxidase (WGA-HRP) and filled circles represent WGA-HRP neurons double labeled with glutamate. The small and large symbols represent one and five neurons, respectively. The black and gray areas represent the injection center and diffused areas, respectively. The sections were taken from cat HM11. A and P, millimeters anterior and posterior, respectively, to stereotaxic 0. For abbreviations, see list.