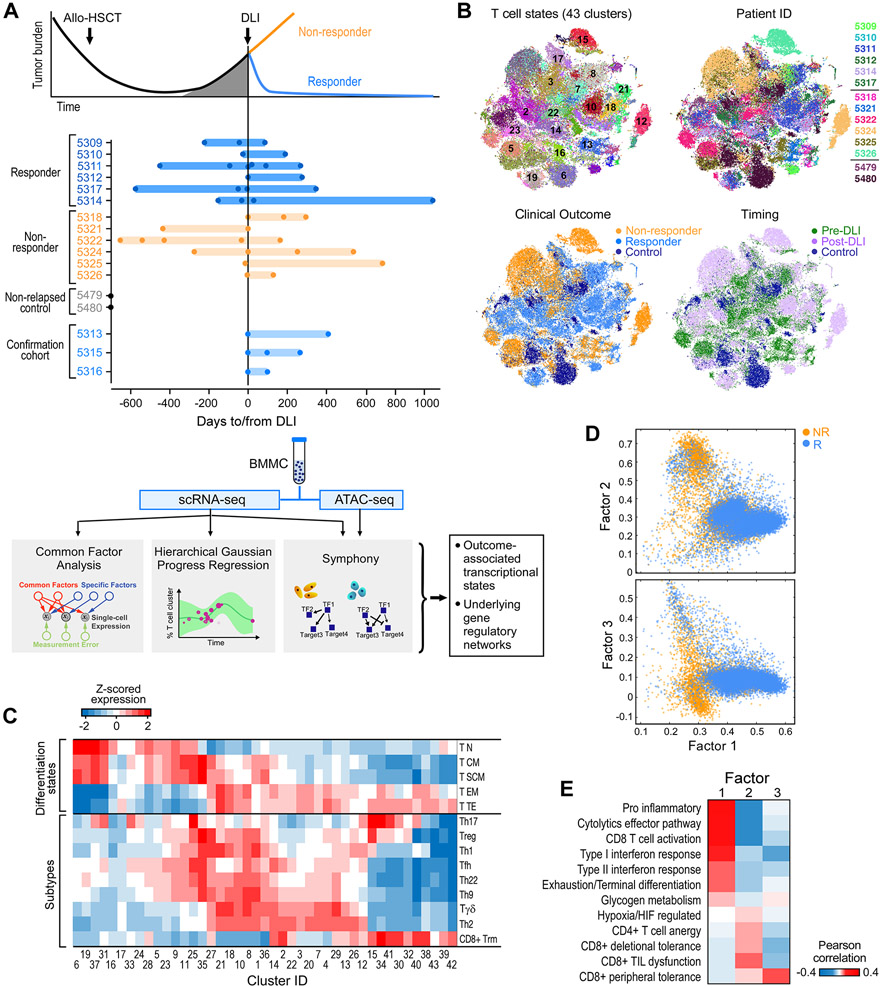
Figure 1. Experimental design and global map of T cell states.
(A) Clinical cohorts, and flow chart of experimental and analysis schema. (B) t-SNE projection of normalized scRNA-seq data for all T cells from 41 samples from discovery cohort. Each dot represents a cell colored by cluster, patient ID, clinical outcome and timing respectively (also expanded in Figure S6B). (C) Mean expression for a curated set of transcriptomic signatures representing T cell subtypes and differentiation states for each T cell cluster; expression values are z-scored relative to all T cell clusters. Additional signatures appear in Figure S1D. (D) Common Factor Analysis of T cells identifying 3 common latent factors distinguishing T cells between responders (R) and non-responders (NR). Each dot represents a cell colored by patient outcome and axes show factor loadings. (E) Pearson correlation between common latent factors and mean expression of curated signatures. See also Figures S1, S2, S6 and Tables S1, S2.

