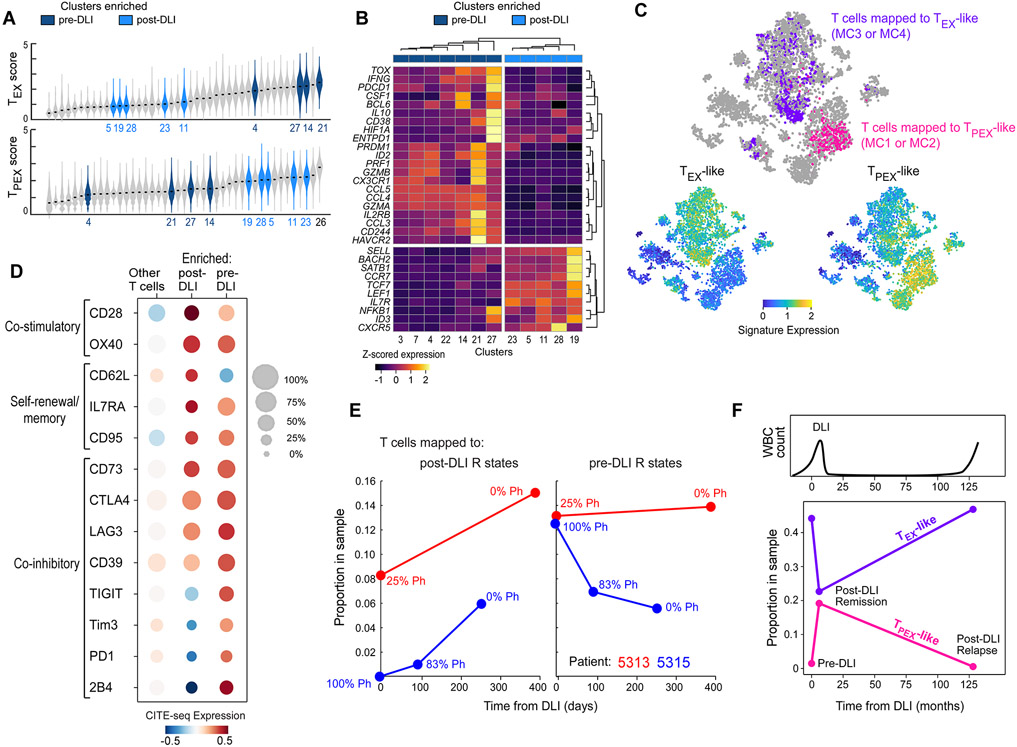
Figure 3. T cell states defining DLI response correspond to exhausted subsets.
(A) Violin plots showing density of viral-specific TEX (top) or TPEX (bottom) signature scores (Im et al., 2016) across T cells grouped by cluster. Clusters are ordered by median score. Colored violins refer to clusters enriched in pre-DLI Rs (dark blue, Figure 2B) or expanding in post-DLI Rs (light blue, Figure 2C). Full labels provided in Figure S6D. (B) Unsupervised hierarchical clustering based on tumor infiltrating TPEX or TEX genes (Miller et al., 2019) segregates dark/light blue clusters. (C) t-SNE projection of all T cells from patients 5313 and 5315, with cells colored by mapped metacluster (top), expression of TPEX gene set (bottom left) or TEX gene set (bottom right). (D) Normalized CITE-seq expression data for defined T cell phenotypes for enriched pre-DLI, enriched post-DLI and all other T cells from patients 5313 and 5315. (E) Post-DLI kinetics of enriched post-DLI (left) and enriched pre-DLI (right) T cells measured by their sample proportion with indicated percentage of tumor burden (%Ph+) for patients 5313 (red) and 5315 (blue). (F) Kinetics of TPEX-like and TEX-like cells in a patient with CLL in post-DLI remission as well as long-term relapse (after 11 years). See also Figures S3, S6, S7 and Table S3.

