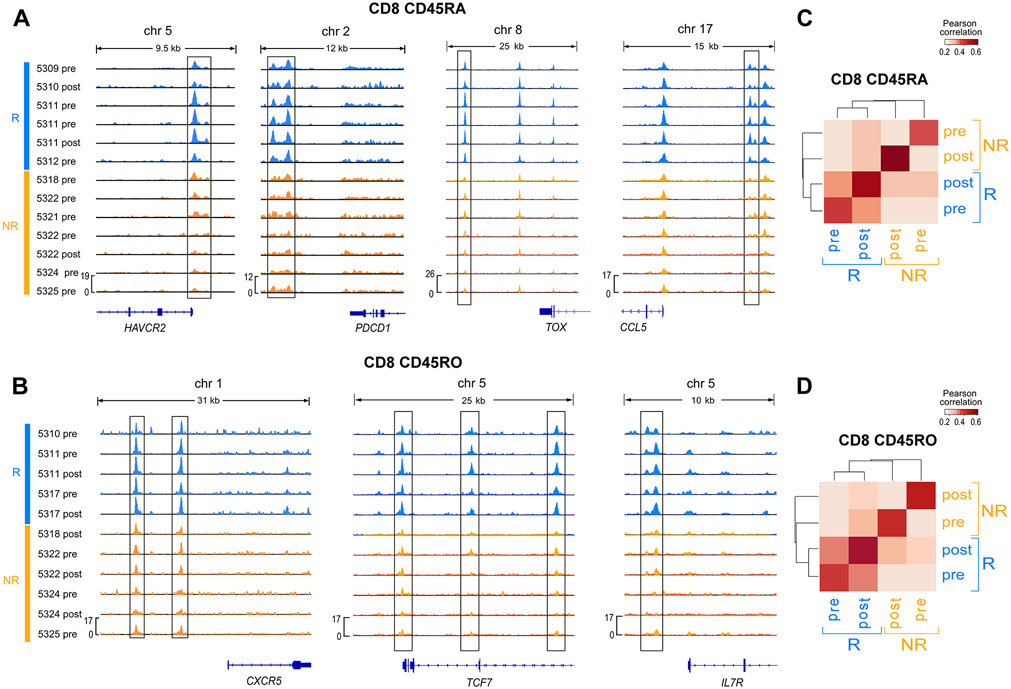
Figure 4. Epigenetic landscape of T cell subsets.
(A-B) Chromatin accessibility signal from ATAC-seq data for CD8+ CD45RA+ (A) and CD8+ CD45RO+ (B) T cells indicating differential accessibility (p<0.05 indicated with boxes) between R and NR in regions near exhaustion marker genes. (C-D) Average pairwise Pearson correlation between normalized ATAC-seq peak heights for CD8+ CD45RA+ (C) and CD8+ CD45RO+ (D) T cells from different clinical groups. See also Figure S4.

